Copyright
©The Author(s) 2016.
World J Gastroenterol. Nov 7, 2016; 22(41): 9172-9185
Published online Nov 7, 2016. doi: 10.3748/wjg.v22.i41.9172
Published online Nov 7, 2016. doi: 10.3748/wjg.v22.i41.9172
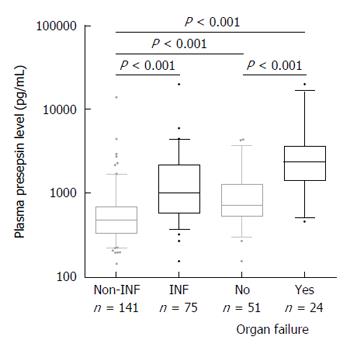
Figure 1 Presepsin levels in patients with cirrhosis according to presence or absence and severity of bacterial infections (n = 216).
Median presepsin levels are significantly higher in patients with infection as compared to those without and associated to the severity of the infection. Lines denote median values, boxes represent 25th-75th percentiles and whiskers indicate the 5th-95th range. P values were calculated by Mann-Whitney U-test or Kruskal-Wallis H-test as appropriate. INF: Bacterial infection.
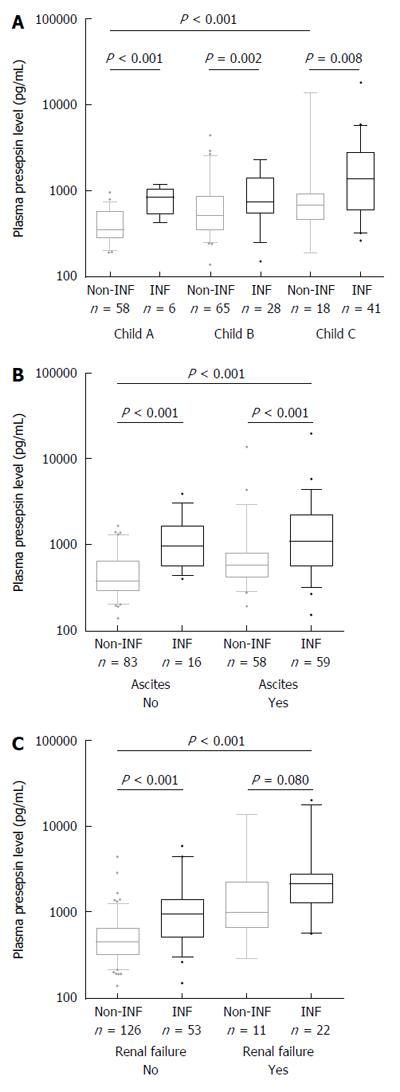
Figure 2 Presepsin levels in subgroups of patients with different diseases severity according to presence or absence of bacterial infections (n = 216).
Significant differences in median presepsin levels between non-infected and infected patients are observed in all disease severity subgroups according to Child-Pugh stage (A) or the presence of ascites (B); However, no significant difference is observed in renal failure subgroup (C). Among non-infected patients, a significant increase in median presepsin levels is observed according to disease severity or in the presence of renal failure. Lines denote median values, boxes represent 25th-75th percentiles and whiskers indicate the 5th-95th range. P values were calculated by the Mann-Whitney U or the Kruskal-Wallis H-test as appropriate. Creatinine values of 4 patients were missing in the non-infected group.
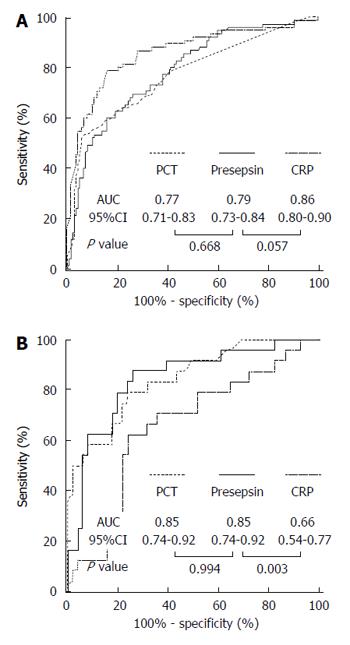
Figure 3 Receiver-operating characteristic curves of presepsin, procalcitonin and C-reactive protein for the identification of bacterial infection overall (A) or bacterial infection complicated by organ failure (B).
ROC analysis were performed (A) in the whole cohort (n = 216) or (B) in patients with bacterial infection (n = 75). The control group comprised (A) patients without bacterial infection (n = 141), or (B) patients with bacterial infection without organ failure (n = 51). AUC: Area under curve; CI: Confidence interval; CRP: C-reactive protein; PCT: Procalcitonin.
- Citation: Papp M, Tornai T, Vitalis Z, Tornai I, Tornai D, Dinya T, Sumegi A, Antal-Szalmas P. Presepsin teardown - pitfalls of biomarkers in the diagnosis and prognosis of bacterial infection in cirrhosis. World J Gastroenterol 2016; 22(41): 9172-9185
- URL: https://www.wjgnet.com/1007-9327/full/v22/i41/9172.htm
- DOI: https://dx.doi.org/10.3748/wjg.v22.i41.9172


