Copyright
©The Author(s) 2016.
World J Gastroenterol. Nov 7, 2016; 22(41): 9117-9126
Published online Nov 7, 2016. doi: 10.3748/wjg.v22.i41.9117
Published online Nov 7, 2016. doi: 10.3748/wjg.v22.i41.9117
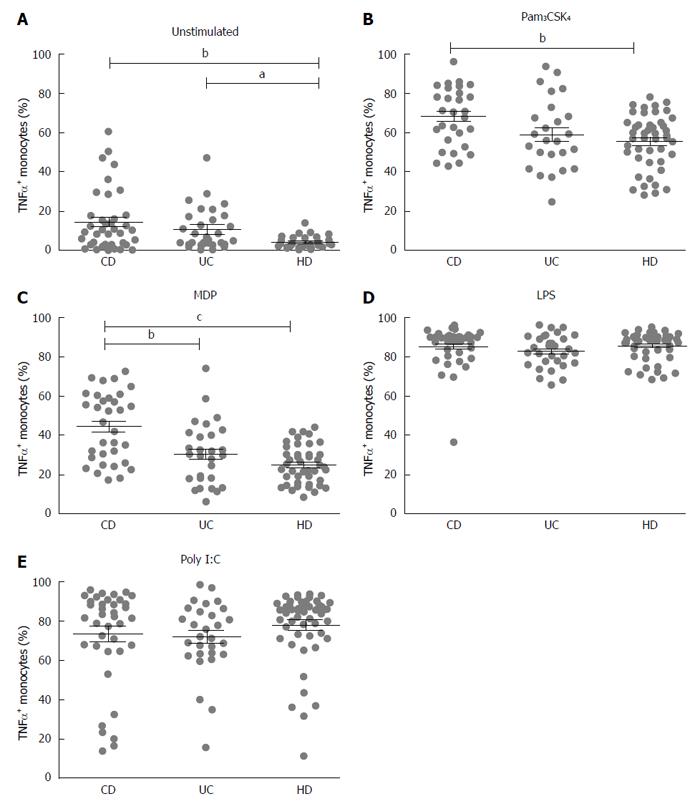
Figure 1 Intracellular tumor necrosis factor-alpha expression in peripheral monocytes.
Intracellular TNF-α expression in peripheral monocytes derived from patients affected by Crohn’s disease (CD), ulcerative colitis (UC) and healthy donors (HD), in basal condition (A), or after stimulation with Pam3CSK4 (B), MDP-L18 (C), LPS (D) or Poly I:C (E). Data are presented as mean ± SEM. Statistical significance is denoted by letters (aP < 0.05, bP < 0.01, cP < 0.001 vs HD).
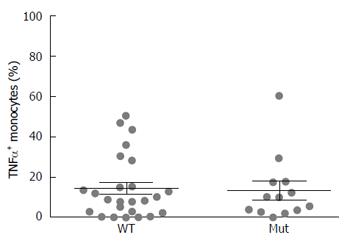
Figure 2 Intracellular tumor necrosis factor-alpha expression in wild type or mutation-carrier patients.
Intracellular TNF-α expression in basal conditions measured in peripheral monocytes derived from patients affected by Crohn’s disease (CD), grouped into Wild Type (WT) or mutation carriers (Mut) for the three NOD2 polymorphisms (R702W, G908R and L1007Pfs*2). Data are presented as mean ± SEM. No statistical significances was found.
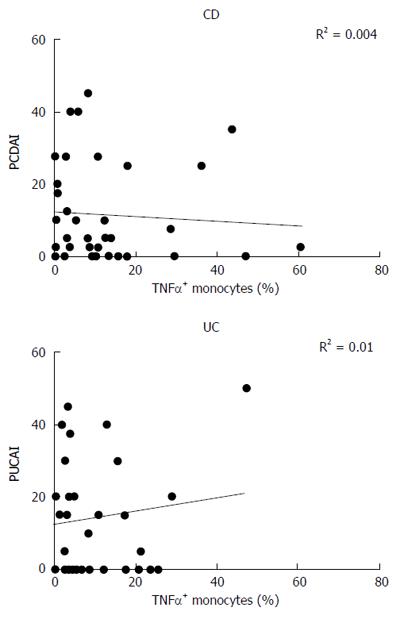
Figure 3 Correlation of disease activity index with monocyte expression of tumor necrosis factor-alpha in inflammatory bowel disease patients.
Correlation of activity index, expressed by PCDAI (Pediatric Crohn’s disease Activity Index) or PUCAI (Pediatric Ulcerative Colitis Activity Index) with monocyte expression of TNF-α in patients suffering from Crohn’s disease (CD) and ulcerative colitis (UC). The squared Pearson correlation coefficients (R2) are shown.
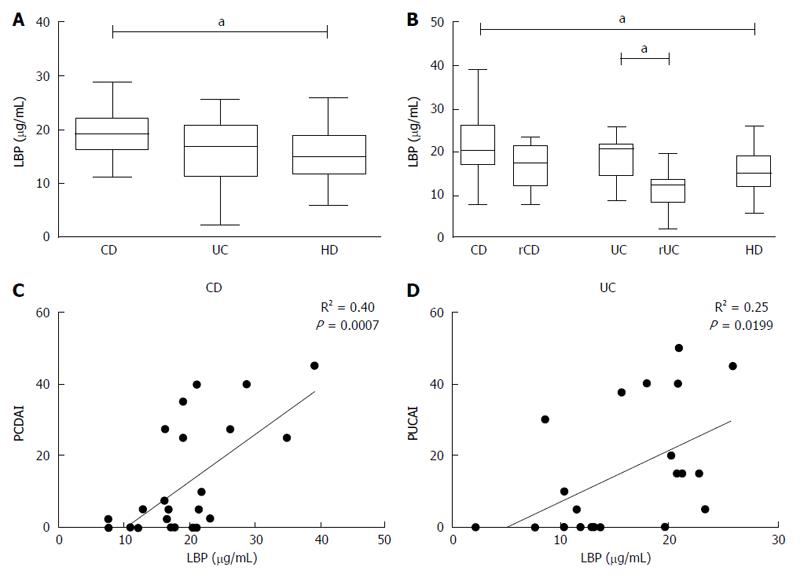
Figure 4 Dosage of LPS-binding protein and correlation with disease activity index.
A, B: Quantification of plasmatic LPS-Binding Protein (LBP) from patients affected by active Crohn’s disease (CD), remissive Crohn’s disease (rCD), active Ulcerative Colitis (UC), remissive Ulcerative Colitis (rUC) and healthy donors (HD). Data are represented with box plots using Tukey’s whiskers. Statistical significance is denoted by letters (aP < 0.05); C, D: Correlation between activity Index, expressed by PCDAI (Pediatric Crohn’s Disease Activity Index) or PUCAI (Pediatric Ulcerative Colitis Activity Index) with plasmatic level of LBP in patients with Crohn’s disease (CD) (C, R2 = 0.40) or Ulcerative Colitis (UC) (D, R2 = 0.25). The squared Pearson correlation coefficients (R2) and the P value are shown.
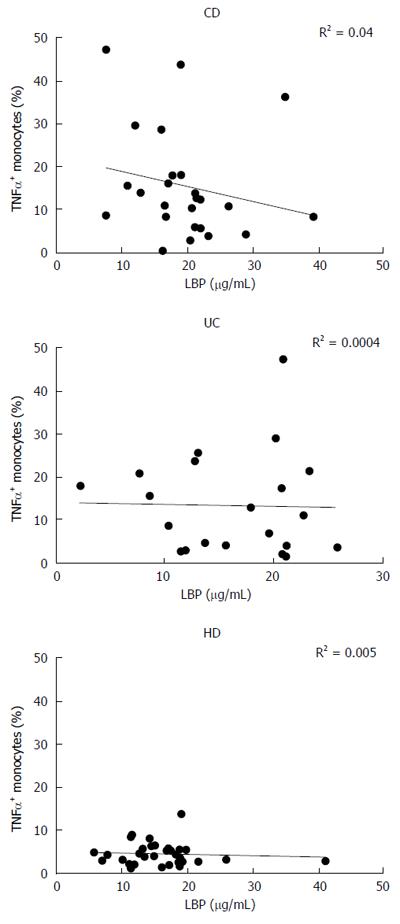
Figure 5 Correlation of monocyte tumor necrosis factor-alpha expression and LPS-binding protein levels in inflammatory bowel disease patients.
Correlation between monocyte expression of tumor necrosis factor-alpha (TNF-α) and plasmatic level of LBP in patients affected by Crohn’s disease (CD) or ulcerative colitis (UC) and in healthy subjects (HD). The squared Pearson correlation coefficients (R2) are shown. No statistical significances were found.
- Citation: Loganes C, Pin A, Naviglio S, Girardelli M, Bianco AM, Martelossi S, Tommasini A, Piscianz E. Altered pattern of tumor necrosis factor-alpha production in peripheral blood monocytes from Crohn's disease. World J Gastroenterol 2016; 22(41): 9117-9126
- URL: https://www.wjgnet.com/1007-9327/full/v22/i41/9117.htm
- DOI: https://dx.doi.org/10.3748/wjg.v22.i41.9117


