Copyright
©The Author(s) 2016.
World J Gastroenterol. Jan 28, 2016; 22(4): 1393-1404
Published online Jan 28, 2016. doi: 10.3748/wjg.v22.i4.1393
Published online Jan 28, 2016. doi: 10.3748/wjg.v22.i4.1393
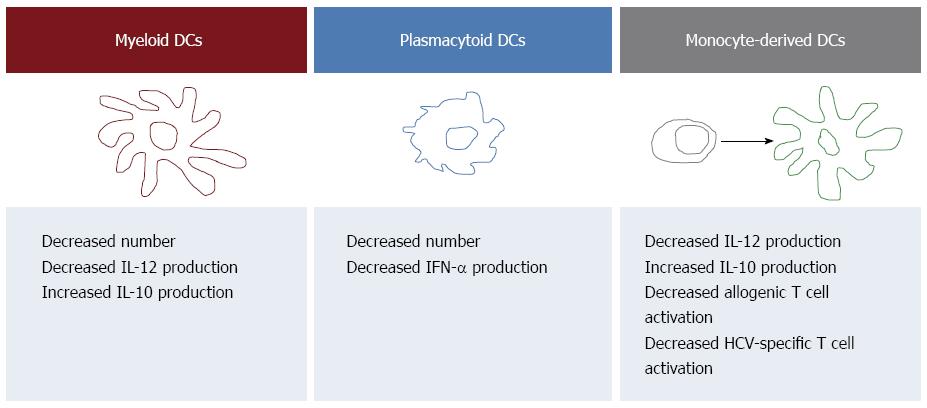
Figure 1 Summary of the hepatitis C virus-associated alterations of dendritic cells detectable in the peripheral blood.
Patients with chronic hepatitis C undergo changes in the number and function of both myeloid dendritic cells (mDCs) and plasmacytoid DCs (pDCs) that may be relevant to the pathogenesis of chronic HCV infection. In particular, several Authors demonstrated that pDCs, which are specialized in antiviral immune responses, are decreased in HCV-infected patients and are endowed with a reduced ability to produce interferon (IFN). mDCs, that contribute to the activation of cellular immunity through the production of interleukin (IL)12, are decreased as well and characterized by reduced production of IL12 and increased production of the immunosuppressive cytokine IL10. These last functional defects are shared by monocyte-derived DCs that are also endowed with decreased ability to activate T cells. All references are reported in the text.
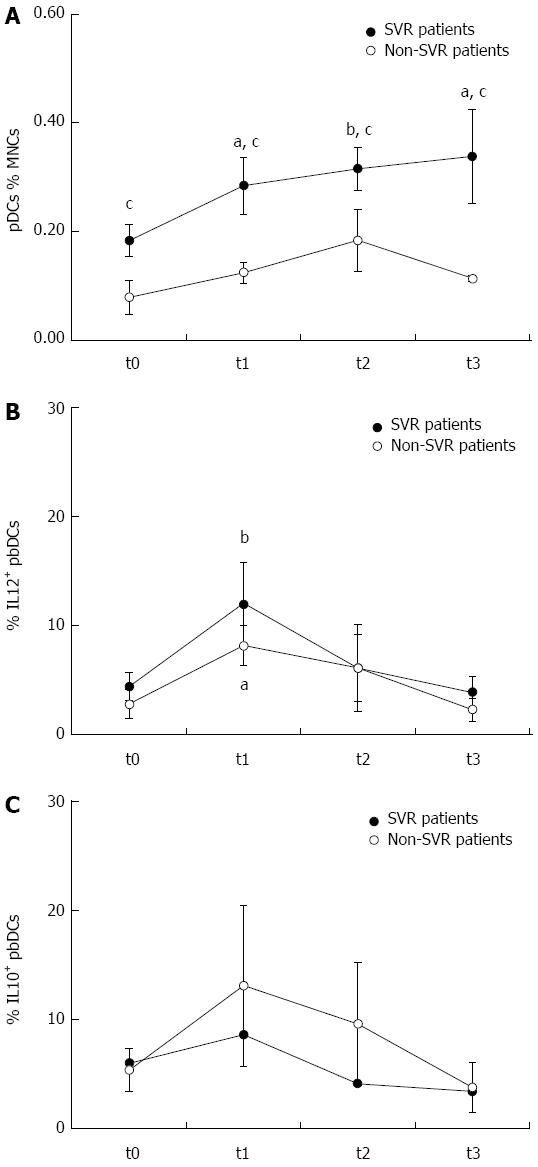
Figure 2 Effects of dual therapy with pegylated interferon and ribavirin on peripheral blood dendritic cells.
The treatment induced a rapid, progressive and persistent increase of plasmacytoid dendritic cells (pDCs) in sustained virological response (SVR) but not in non-SVR patients. The frequency of pDCs was higher in SVR than non-SVR patients at all the time points. pegIFN and RBV treatment also induced a transient increase of peripheral blood DC production of interleukin (IL)12, that was observed after 1 mo of treatment but decreased thereafter, and that was more pronounced in SVR than non-SVR patients. IL10 production showed a similar trend and tended to be higher in non-SVR patients. aP < 0.05 and bP < 0.01, respectively, any time vs t0 within each group, as assessed by Wilcoxon signed rank test; cP < 0.05, SVR vs non-SVR, as assessed by Mann-Whitney test. t0: Before treatment; t1: After 1 mo of treatment; t2: At the end of treatment; t3: 6 mo after treatment completion.
- Citation: Crosignani A, Riva A, Della Bella S. Analysis of peripheral blood dendritic cells as a non-invasive tool in the follow-up of patients with chronic hepatitis C. World J Gastroenterol 2016; 22(4): 1393-1404
- URL: https://www.wjgnet.com/1007-9327/full/v22/i4/1393.htm
- DOI: https://dx.doi.org/10.3748/wjg.v22.i4.1393


