Copyright
©The Author(s) 2016.
World J Gastroenterol. Oct 21, 2016; 22(39): 8779-8789
Published online Oct 21, 2016. doi: 10.3748/wjg.v22.i39.8779
Published online Oct 21, 2016. doi: 10.3748/wjg.v22.i39.8779
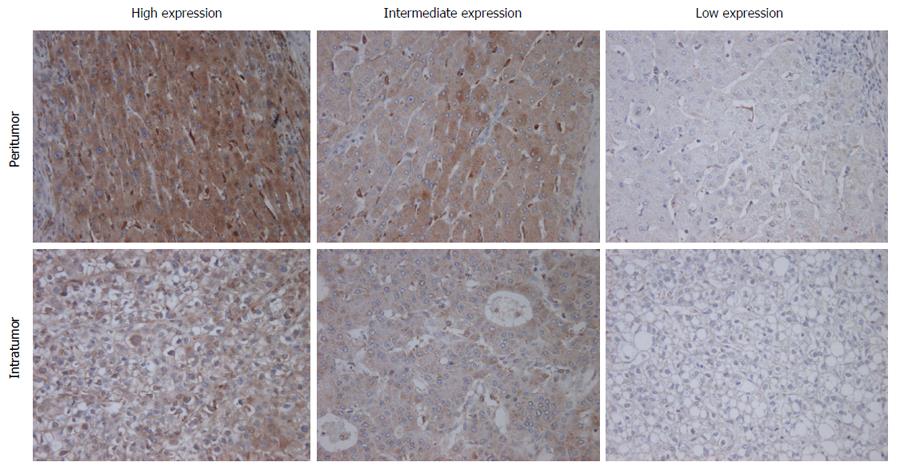
Figure 1 Immunohistochemical staining for macrophage colony-stimulating factor.
Immunohistochemical staining for M-CSF in intratumoral and peritumoral tissues in the liver was performed as described in Patients and Methods. Representative photomicrographs are shown. Original magnification, × 400.
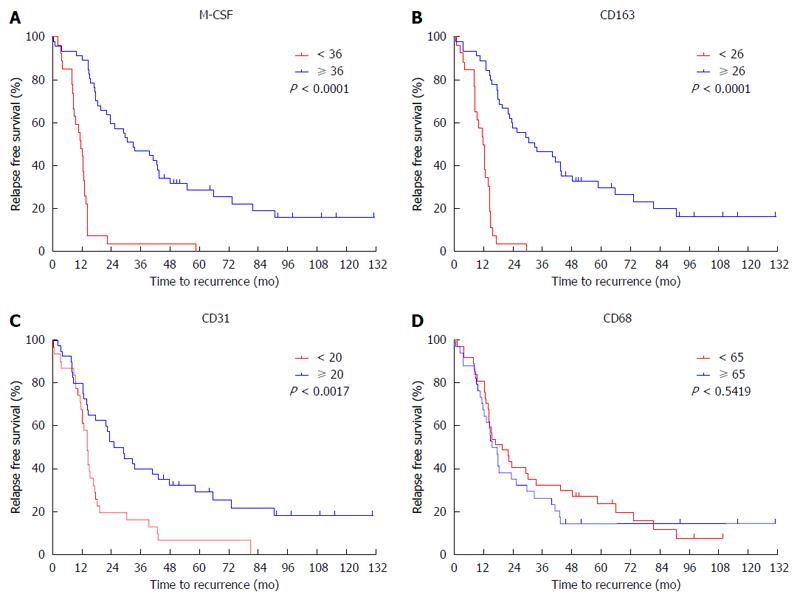
Figure 2 Cumulative disease-free survival curves of patients with high or low peritumoral features.
Disease free survival curves of patients with high or low expression of CD68, CD163, CD31 and macrophage colony-stimulating factor (M-CSF) in peritumoral liver tissues are shown. A: M-CSF; B: CD163; C: CD31; D: CD68. The intratumoral features were not associated with disease-free survival.
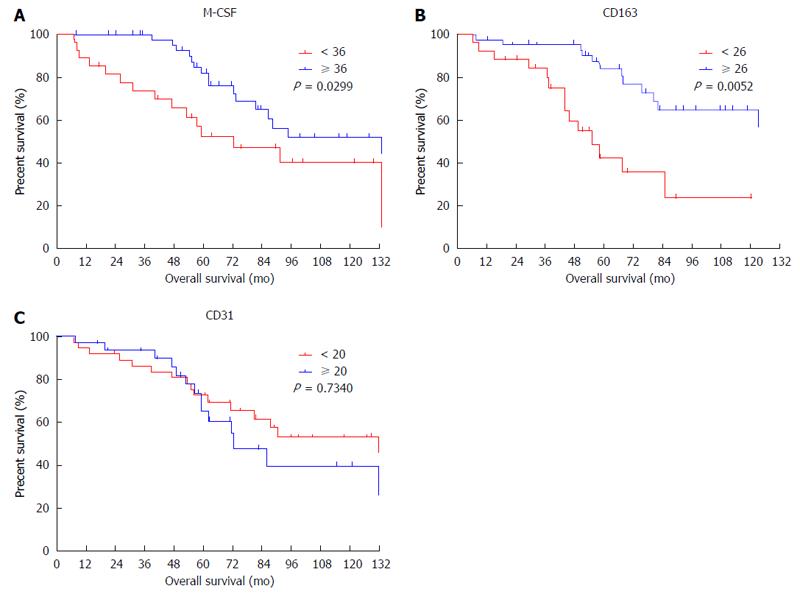
Figure 3 Cumulative overall survival curves of patients with high or low macrophage colony-stimulating factor expression in peritumoral features.
Overall survival curves of patients with high or low expression of macrophage colony-stimulating factor (M-CSF) in peritumoral liver tissues are shown. A: M-CSF; B: CD163; C: CD31. The intratumoral features were not associated with overall survival.
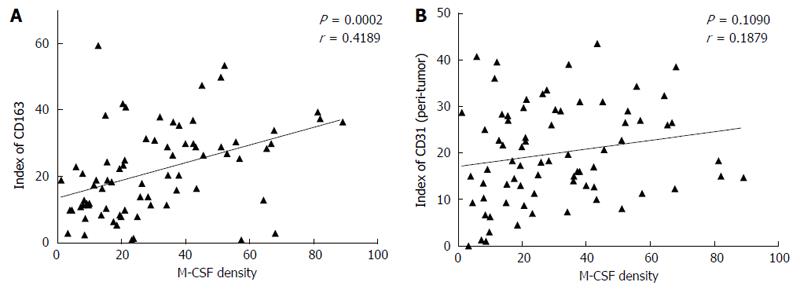
Figure 4 Correlation between the expression of macrophage colony-stimulating factor and CD163, or CD31 in the non-tumoral liver tissues.
Immunohistochemical staining for macrophage colony-stimulating factor (M-CSF), CD163, and CD31 was performed in non-cancerous liver tissue collected from patients as described in detail in the Patients and Methods section. A (between M-CSF and CD163) and B (between M-CSF and CD31) show correlations between markers assessed in this study in each of the patients with HCC.
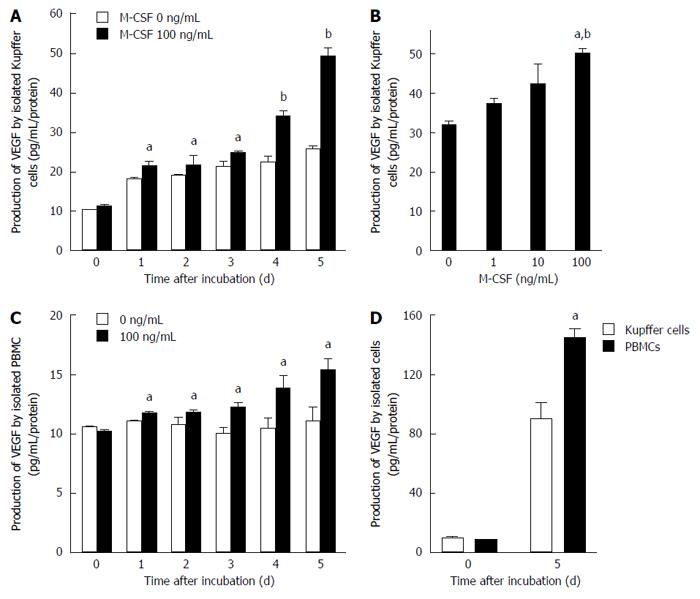
Figure 5 Production of vascular endothelial growth factor by isolated Kupffer cells and peripheral blood monocytes.
Production of vascular endothelial growth factor (VEGF) by isolated Kupffer cells and peripheral blood monocytes was determined as described in the Methods. A: Kupffer cells were cultured with or without macrophage colony-stimulating factor (M-CSF) in media for designated experimental periods (n = 6). aP < 0.05 vs with Kupffer cells without M-CSF stimulation; and bP < 0.01 vs with Kupffer cells without M-CSF stimulation by ANOVA with Bonferroni’s post-hoc test; B: Kupffer cells were treated with different doses of M-CSF in media, and cultured for 5 d (n = 6). aP < 0.05 vs with Kupffer cells without M-CSF stimulation; and bP < 0.01 vs with Kupffer cells with 10 ng/mL of M-CSF in media by ANOVA with Bonferroni’s post-hoc test; C: Peripheral blood monocytes were isolated and were cultured for designated experimental periods. The concentration of VEGF in media was then determined as described in the Methods (n = 6). aP < 0.05 vs with peripheral blood monocytes without M-CSF stimulation by ANOVA with Bonferroni’s post-hoc test; D: Isolated Kupffer cells or PBMC were incubated with 100 ng/mL of M-CSF in media for 5 d. The concentration of VEGF was determined as described in Materials and Methods (n = 6). aP < 0.05 vs with PBMC by ANOVA with Bonferroni’s post-hoc test.
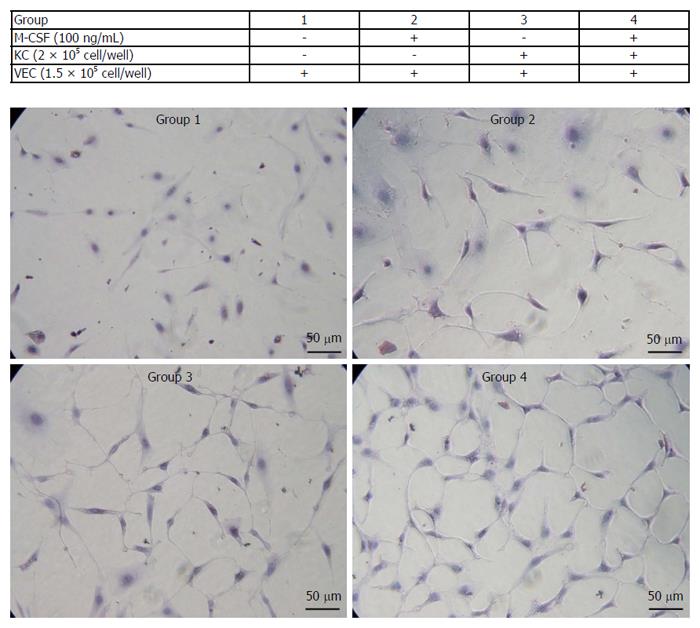
Figure 6 Proliferation of isolated vascular endothelial cells.
Isolated vascular endothelial cells (VECs) were co-cultured with or without the isolated Kupffer cells in media containing of macrophage colony-stimulating factor (M-CSF). Cell proliferation of VECs was determined as described in the Patients and Methods (n = 5). Treatments of each group are shown in the table. Representative photomicrographs are shown. Original magnification, × 400.
- Citation: Kono H, Fujii H, Furuya S, Hara M, Hirayama K, Akazawa Y, Nakata Y, Tsuchiya M, Hosomura N, Sun C. Macrophage colony-stimulating factor expressed in non-cancer tissues provides predictive powers for recurrence in hepatocellular carcinoma. World J Gastroenterol 2016; 22(39): 8779-8789
- URL: https://www.wjgnet.com/1007-9327/full/v22/i39/8779.htm
- DOI: https://dx.doi.org/10.3748/wjg.v22.i39.8779


