Copyright
©The Author(s) 2016.
World J Gastroenterol. Oct 14, 2016; 22(38): 8519-8527
Published online Oct 14, 2016. doi: 10.3748/wjg.v22.i38.8519
Published online Oct 14, 2016. doi: 10.3748/wjg.v22.i38.8519
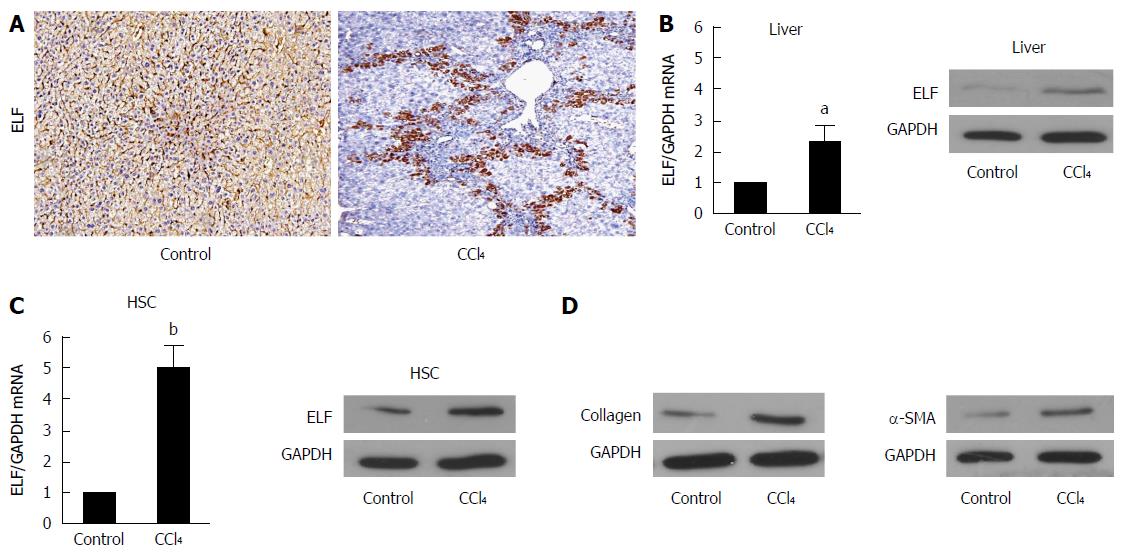
Figure 1 Embryonic liver fordin expression is upregulated in fibrotic livers and hepatic stellate cells.
A: The Embryonic liver fordin (ELF) expression in cirrhotic livers was determined by the immunohistochemical analysis. Magnification × 200; B: Real-time RT-PCR and Western blot analysis were used to evaluate the ELF expression in the liver homogenates from the control and CCl4-treated mice. aP < 0.05, the CCl4-treated mice vs the control mice. GAPDH was used as the control; C: Real-time RT-PCR and Western blot analysis were used to evaluate the ELF expression in the primary hepatic stellate cells (HSCs) isolated from the control and CCl -treated mice. bP < 0.01, the CCl4-treated mice vs the control mice; D: The α-SMA and collagen I expression at the protein level were upregulated in the whole liver homogenates from the CCl4-treated mice compared with the controls.
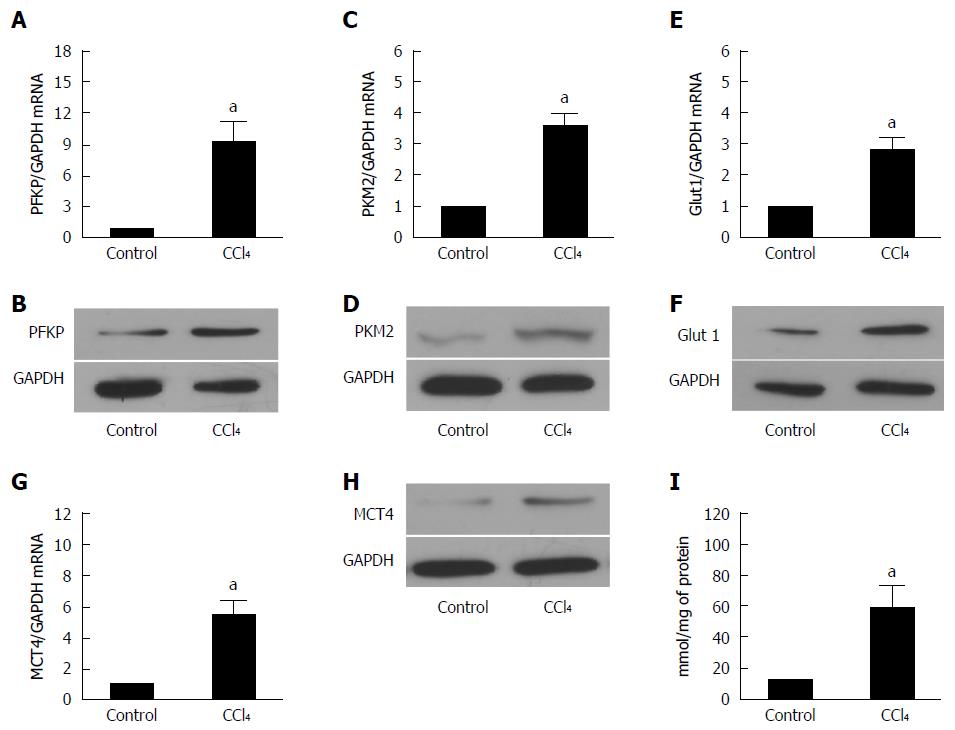
Figure 2 Glycolysis related-genes are upregulated in liver fibrosis.
A, C: The real-time RT-PCR analysis evaluated the expression of the hepatic glycolytic enzymes, PFKP and PFKM2 in fibrotic and control mice. The PFKP and PFKM2 expression of the mRNA level was increased compared with that of the control (aP < 0.05 vs control). GAPDH was used as the control; B, D: Western blot analysis indicated that the PFKP and PFKM2 expression of the protein level was upregulated in the fibrotic livers; E: The real-time RT-PCR analysis evaluated the hepatic glucose transporter, Glut 1, expression in the fibrotic livers and the control mice. The expression of Glut 1 mRNA was increased compared with that of the controls (aP < 0.05 vs control); F: Western blot analysis indicated that the expression of the Glut 1 at protein level was upregulated in the fibrotic livers; G: Real-time RT-PCR analysis evaluated the MCT4 hepatic lactate transporter expression in the fibrotic livers and the control mice. The expression of the Glut 1 mRNA was increased compared with that of the controls (aP < 0.05 vs control); H: Western blot analysis indicated that the expression of MCT4 at protein level was upregulated in the fibrotic liver; I: The intracellular lactate was evaluated by a lactate assay kit (aP < 0.05 vs control).
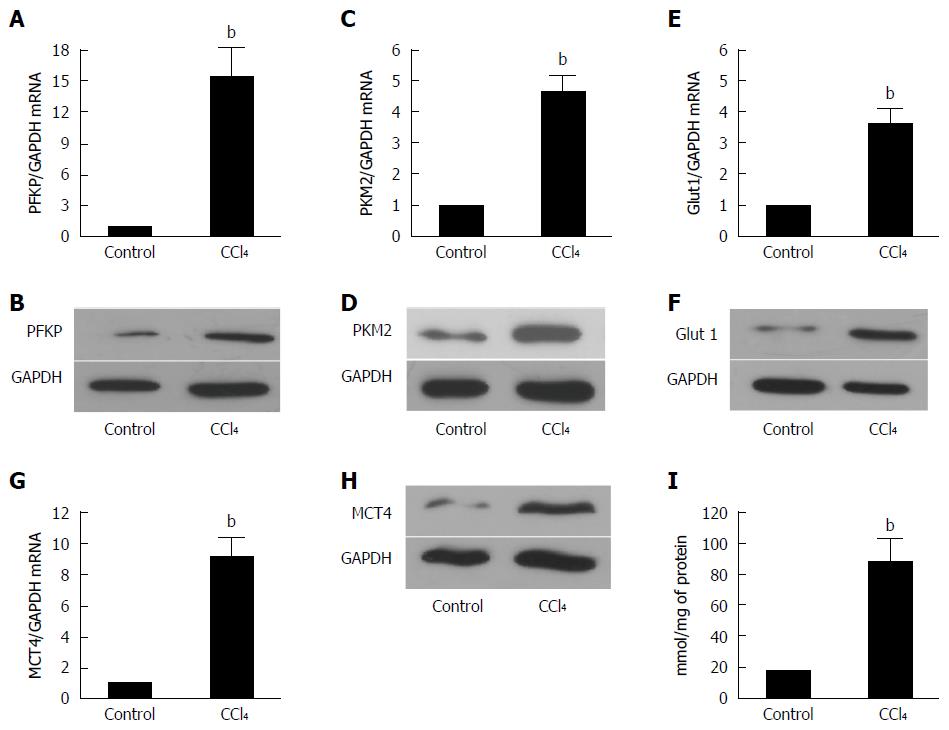
Figure 3 Glycolysis related-genes are upregulated significantly in the HSCs isolated from the fibrotic livers.
A, C: The real-time RT-PCR analysis was used to evaluate the expression of the PFKP and PFKM2 hepatic glycolytic enzymes in the fibrotic livers and control mice. The PFKP, pAKT, and PFKM2 expressions of the mRNA level were increased compared with those of the controls (bP < 0.01 vs control). GAPDH was used as the control; B, D: The Western blot analysis indicated that the PFKP and PFKM2 expression at the protein level was upregulated in the fibrotic livers; E: The real-time RT-PCR analysis evaluated the hepatic glucose transporter Glut 1 expression in the fibrotic livers and control mice. The expression of Glut 1 mRNA was increased compare with that of the controls (bP < 0.01 vs control); F: The Western blot analysis indicated that the Glut 1 expression at the protein level was upregulated in the fibrotic livers; G: The real-time RT-PCR analysis evaluated the hepatic lactate transporter MCT4 expression in the fibrotic livers and the control mice. The Glut 1 expression at the mRNA level was increased compared with that of the controls (bP < 0.01 vs control); H: The western blot analysis indicated that the MCT4 expression at the protein level was upregulated in the fibrotic livers; I: The intracellular lactate was evaluated by a lactate assay kit (bP < 0.01 vs control).
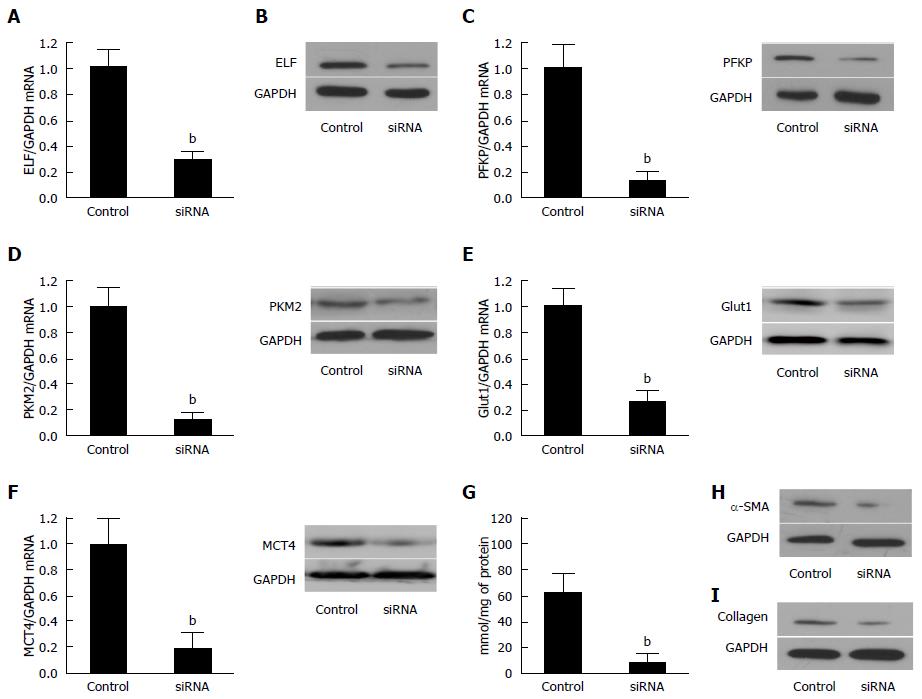
Figure 4 Silencing of Embryonic liver fordin in the activated hepatic stellate cells led to the inhibition of glycolysis.
A: The ELF mRNA was reduced in the activated hepatic stellate cells (HSCs) transfected synthetic siRNA against ELF was assessed by real-time RT-PCR. P < 0.01 for the ELF siRNA versus the siRNA controls. GAPDH was used as the control; B: Western blot analysis confirmed that synthetic siRNA inhibited the ELF expression in the activated HSCs; C, D: The hepatic glycolytic enzymes, PFKP and PFKM2, expression of the mRNA and protein level decreased significantly after the ELF siRNA treatment (aP < 0.05 vs control). E, F: The hepatic glycolytic enzymes, Glut 1 and MCT 4, expression of the mRNA at the protein level decreased significantly after the ELF siRNA treatment (aP < 0.05 vs control). G: The intracellular lactate level decreased significantly after the ELF siRNA treatment (aP < 0.05 vs control); H, I: The main components of the extracellular matrix, α-SMA and collagen I, expression showed a remarkable decrease in the activated HSCs, and the HSC transfected synthetic siRNA against ELF.
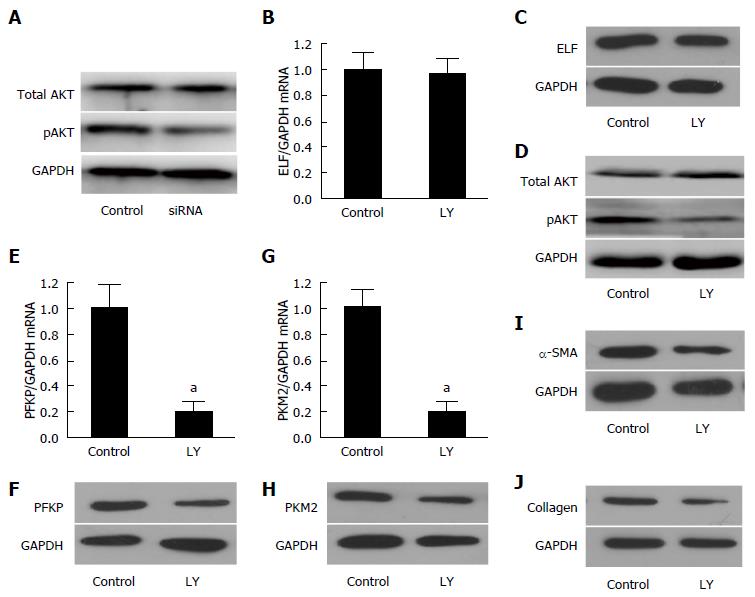
Figure 5 Embryonic liver fordin was involved in the regulation of HSC glycolysis through PI3K/AKT signaling.
A: The key protein of PI3K/akt signaling, pAKT, decreased significantly in the embryonic liver fordin (ELF)-siRNA treated hepatic stellate cells (HSCs), but the expression of total AKT was not affected by ELF-siRNA treatment. GAPDH was used as the control; B, C: The Western blot and real-time RT-PCR analysis indicated that the ELF expression was not affected by Ly294002, an inhibitor of the PI3K/akt signaling; D: The pAKT expression decreased obviously after the inhibition of the PI3K/akt signaling in the HSCs; E, F: The hepatic glycolytic enzymes PFKP expression of mRNA and the protein level decreased significantly after the Ly294002 treatment in the activated HSCs (aP < 0.05 vs control); G, H: The hepatic glycolytic enzyme PKM2 expression at mRNA and the protein levels decreased significantly after the Ly294002 treatment in the activated HSCs (aP < 0.05 vs control). I, J: The main components of the extracellular matrix, α-SMA and collagen I expression showed a remarkable decrease in the activated HSCs treated by the PI3K/akt signaling inhibitor, Ly294002.
- Citation: Tu W, Ye J, Wang ZJ. Embryonic liver fordin is involved in glucose glycolysis of hepatic stellate cell by regulating PI3K/Akt signaling. World J Gastroenterol 2016; 22(38): 8519-8527
- URL: https://www.wjgnet.com/1007-9327/full/v22/i38/8519.htm
- DOI: https://dx.doi.org/10.3748/wjg.v22.i38.8519


