Copyright
©The Author(s) 2016.
World J Gastroenterol. Oct 7, 2016; 22(37): 8389-8397
Published online Oct 7, 2016. doi: 10.3748/wjg.v22.i37.8389
Published online Oct 7, 2016. doi: 10.3748/wjg.v22.i37.8389
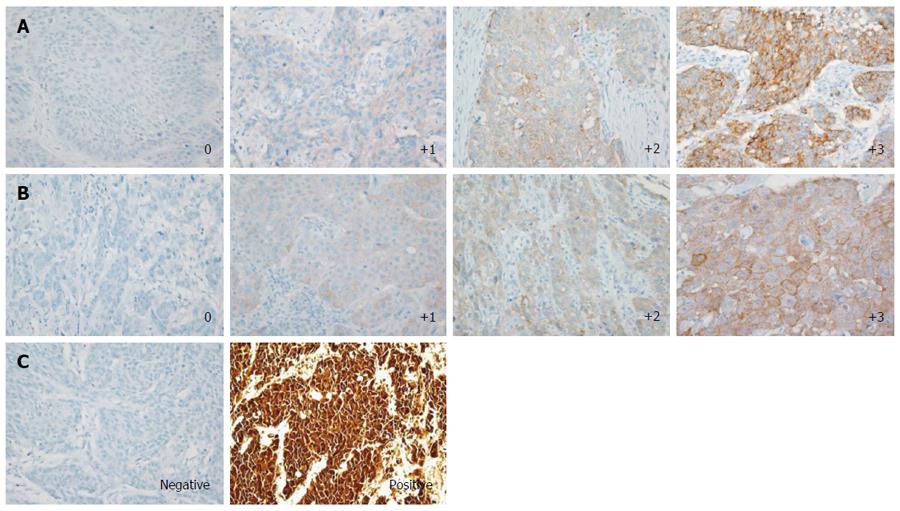
Figure 1 Representative immunohistochemical images of programmed death ligand-1, c-Met, and p16 expression in esophageal squamous cell carcinoma tissues.
A: PD-L1 expression was scored from 0 to 3+. Cases with scores of 0 were considered PD-L1-negative; B: c-Met intensity was scored from 0 to 3+. The H-score was calculated for each case. Cases with H-scores ≥ 50 were considered positive for c-Met expression; C: p16 expression was scored as negative or positive (Original magnification, × 400). PD-L1: Programmed death ligand-1.
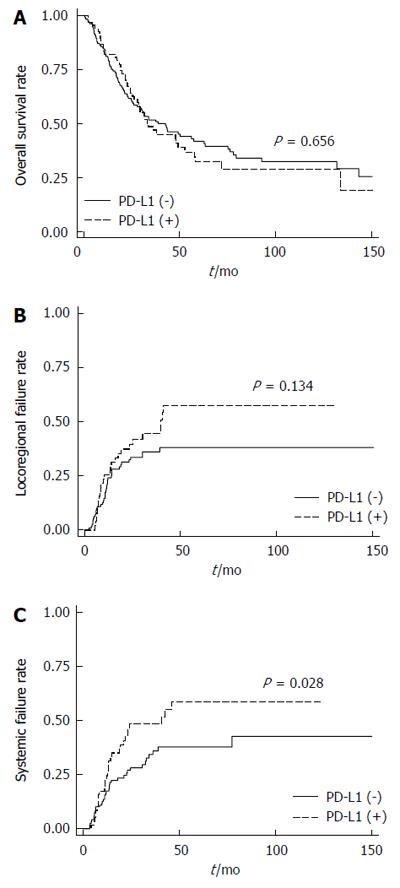
Figure 2 Kaplan-Meier plots for esophageal squamous cell carcinoma patients stratified by programmed death ligand-1 expression.
A: Overall surviva; B: Locoregional relapse rate; C: Distant metastasis rate.
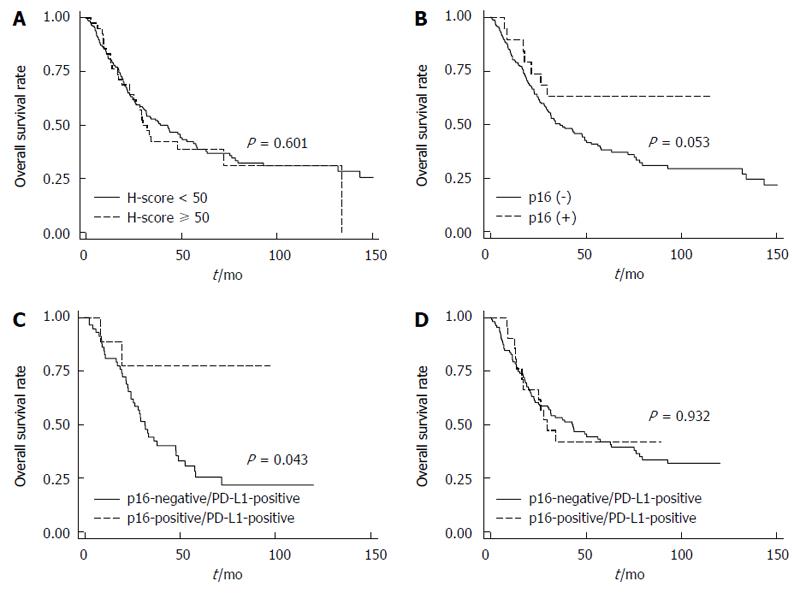
Figure 3 Overall survival according to c-Met, p16 expression.
Kaplan-Meier plots of overall survival for all patients stratified by (A) c-Met expression and (B) p16 expression; Kaplan-Meier plots of overall survival stratified by p16 expression (C) for patients with PD-L1-positive esophageal squamous cell carcinoma; and (D) for patients with PD-L1-negative esophageal squamous cell carcinoma.
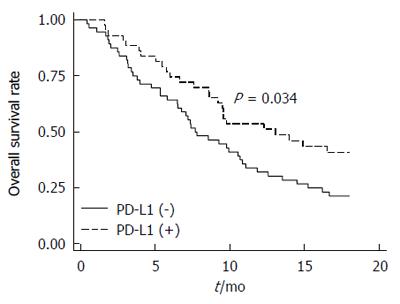
Figure 4 Kaplan-Meier plot of overall survival for esophageal squamous cell carcinoma patients who received palliative treatment.
Overall survival was measured from the date of relapse or surgery (if R0 resection was not achieved) until either death by any cause or the last follow-up date.
- Citation: Kim R, Keam B, Kwon D, Ock CY, Kim M, Kim TM, Kim HJ, Jeon YK, Park IK, Kang CH, Kim DW, Kim YT, Heo DS. Programmed death ligand-1 expression and its prognostic role in esophageal squamous cell carcinoma. World J Gastroenterol 2016; 22(37): 8389-8397
- URL: https://www.wjgnet.com/1007-9327/full/v22/i37/8389.htm
- DOI: https://dx.doi.org/10.3748/wjg.v22.i37.8389


