Copyright
©The Author(s) 2016.
World J Gastroenterol. Sep 14, 2016; 22(34): 7813-7823
Published online Sep 14, 2016. doi: 10.3748/wjg.v22.i34.7813
Published online Sep 14, 2016. doi: 10.3748/wjg.v22.i34.7813
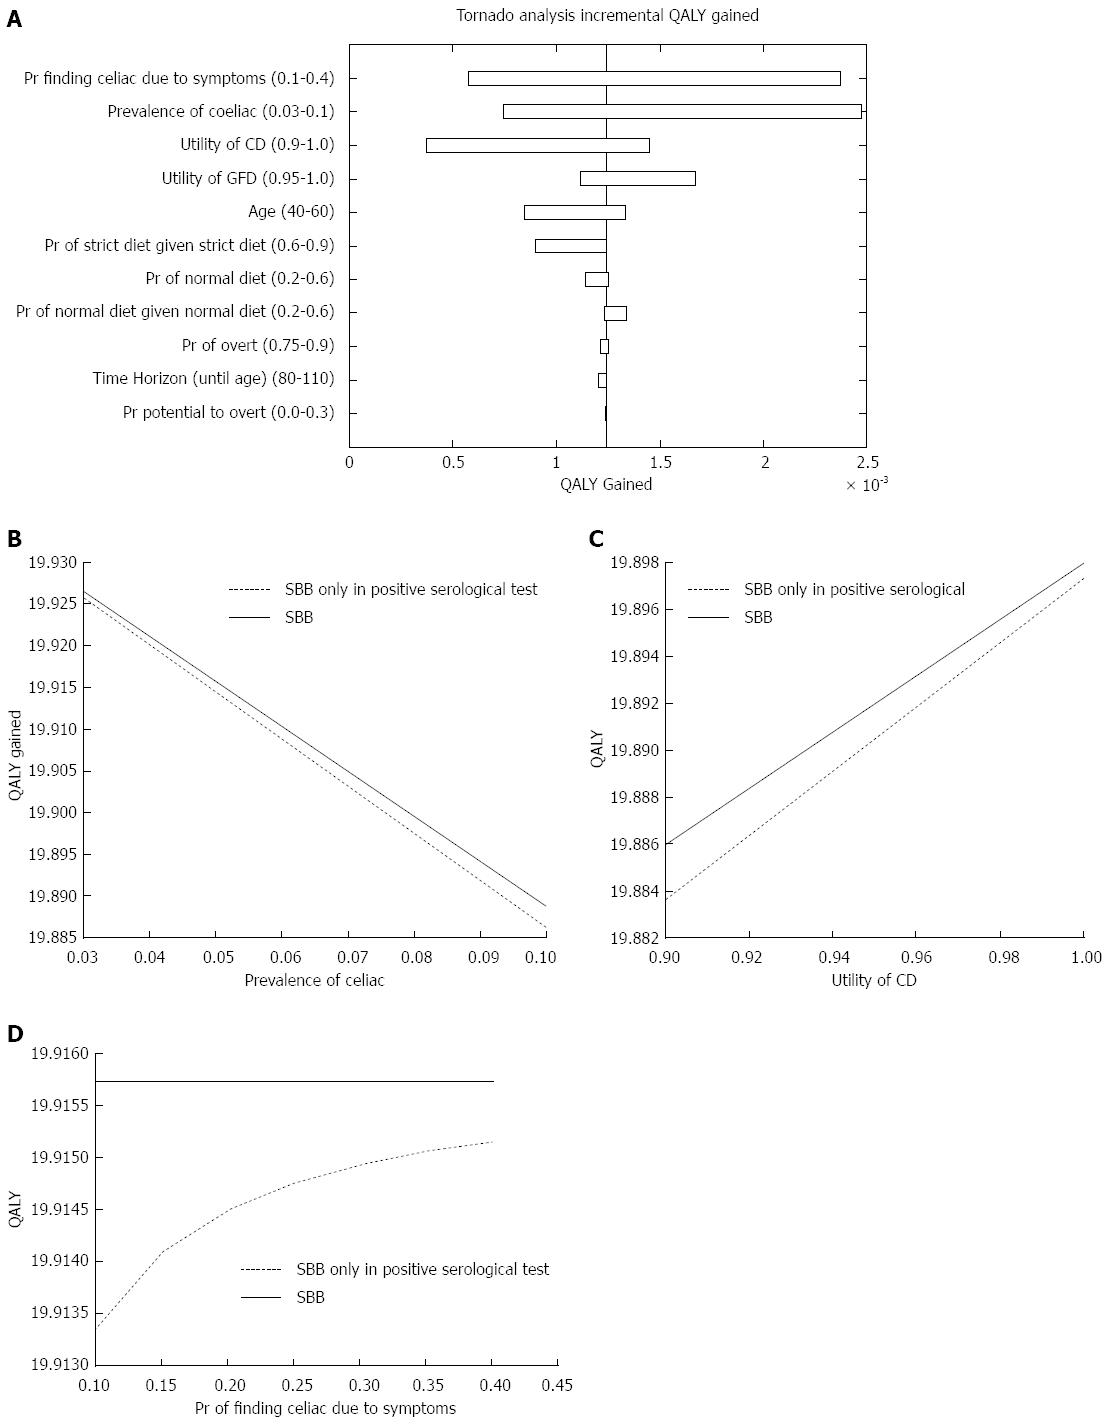
Figure 1 Quality adjusted life-years outcome.
A: Influential parameters on the incremental quality adjusted life-years (QALY); B: One-way sensitivity analysis figure of the prevalence of celiac disease; C: One-way sensitivity analysis figure of the utility of celiac disease; D: One-way sensitivity analysis figure of the probability of diagnosing celiac disease due to symptoms. CD: Celiac disease; GFD: Gluten free diet; SBB: Small bowel biopsy.
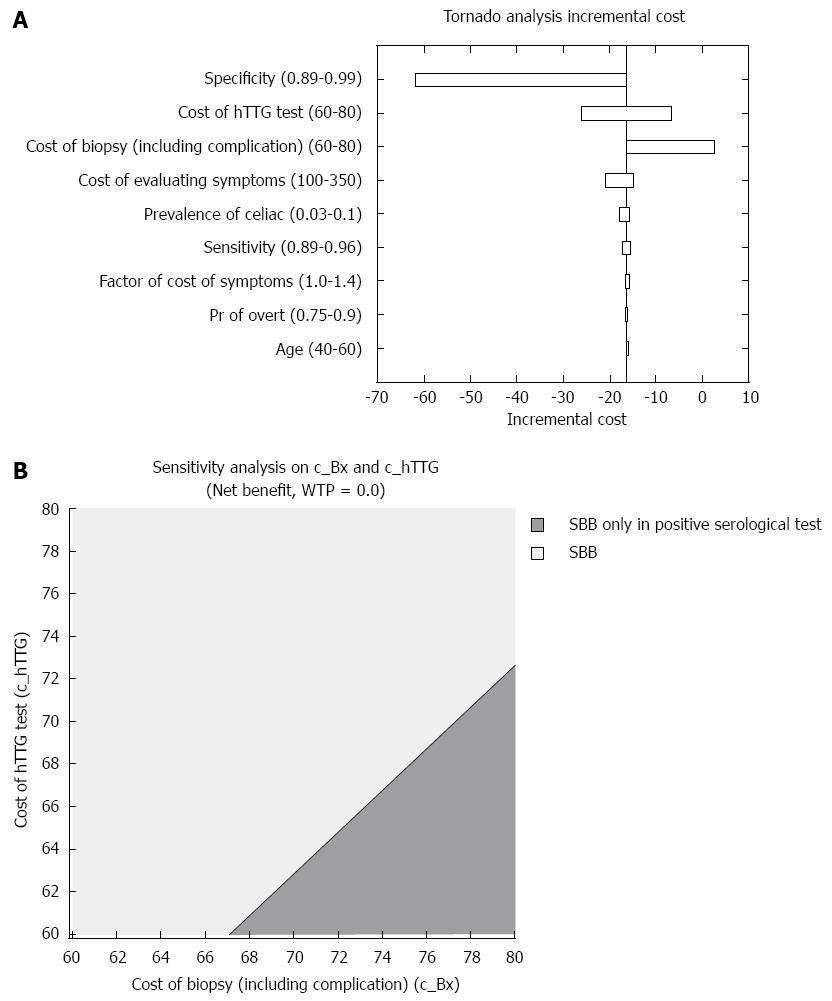
Figure 2 Cost outcome.
A: Influential parameters on the incremental cost; B: Two-way sensitivity analysis depicting the less costly strategy, in regards to serological tests and small bowel biopsies prices.
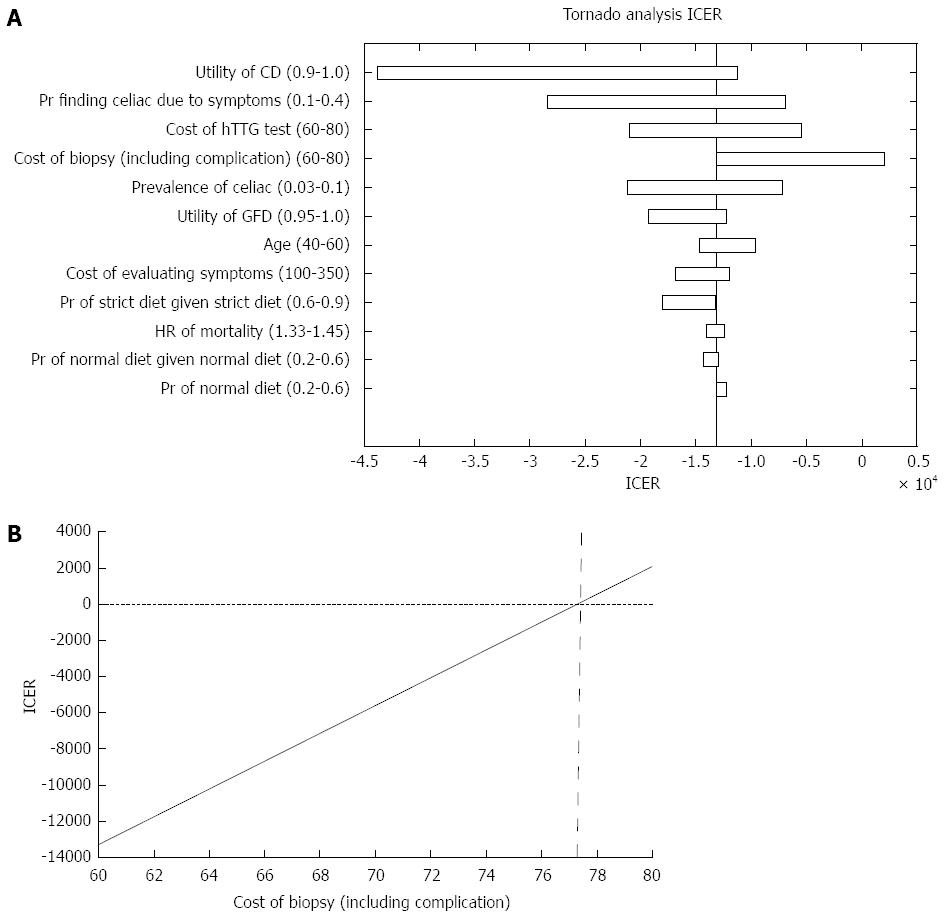
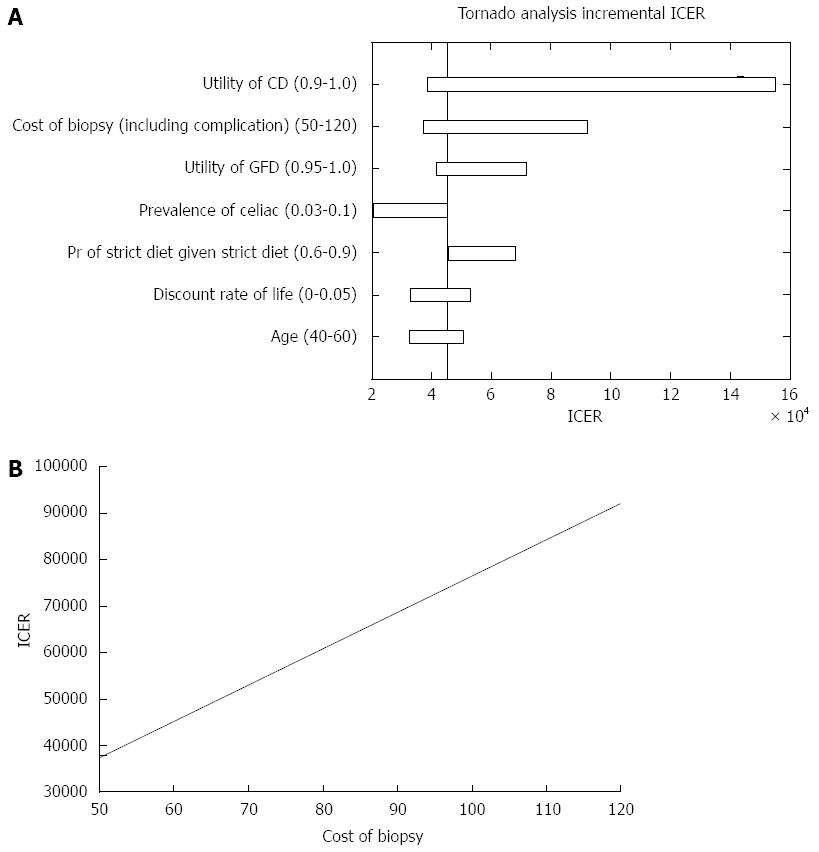
Figure 3 Incremental cost-effectiveness ratio outcome.
A: Parameters that affected the incremental cost-effectiveness ratio (ICER) analysis; B: ICER of both strategies in regard to the cost of small bowel biopsies. CD: Celiac disease; GFD: Gluten free diet.
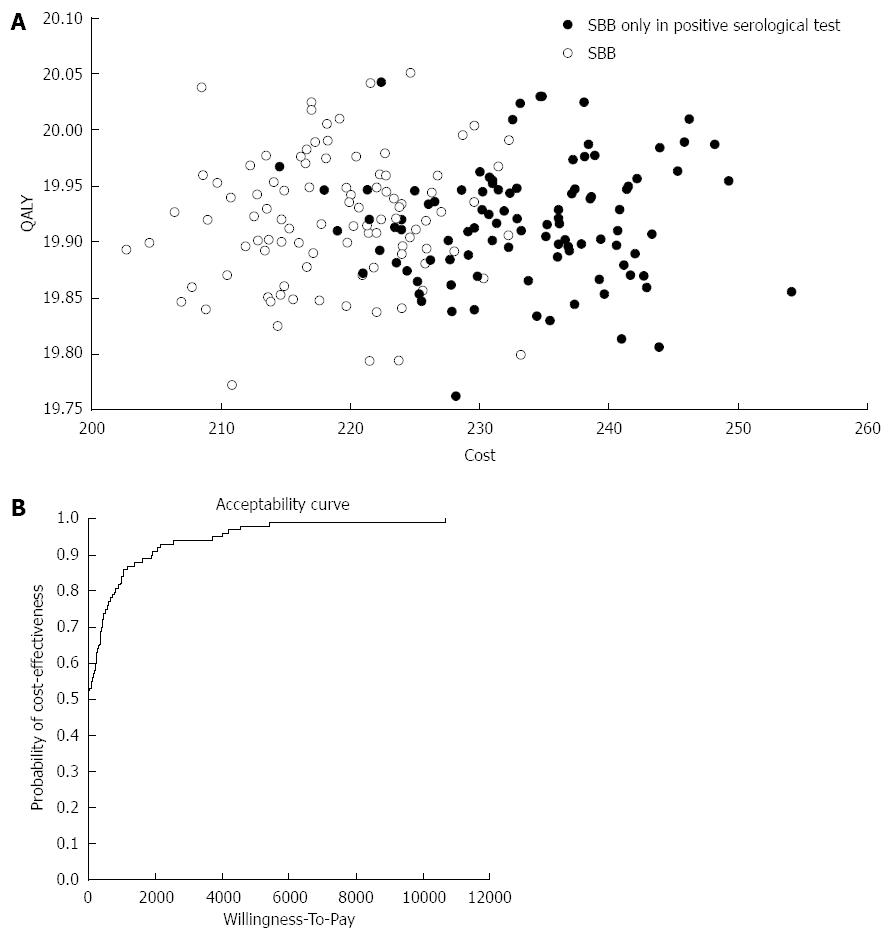
Figure 4 Validation.
A: Monte Carlo simulation of 100 sample trials with 10000 patients in each trial; B: Acceptability curve that validate the cost effectiveness results of the study in relation to the willingness to pay for each quality adjusted life year (QALY). SBB: Small bowel biopsie.
Figure 5 Incremental cost-effectiveness ratio outcome in patients with negative celiac serology.
A: Parameters that affected the incremental cost-effectiveness ratio (ICER) analysis; B: A one way sensitivity analysis of ICER in regards to the cost of small bowel biopsies. CD: Celiac disease; GFD: Gluten free diet.
- Citation: Broide E, Matalon S, Kriger-Sharabi O, Richter V, Shirin H, Leshno M. Cost effectiveness of routine duodenal biopsies in iron deficiency anemia. World J Gastroenterol 2016; 22(34): 7813-7823
- URL: https://www.wjgnet.com/1007-9327/full/v22/i34/7813.htm
- DOI: https://dx.doi.org/10.3748/wjg.v22.i34.7813


