Copyright
©The Author(s) 2016.
World J Gastroenterol. Jul 7, 2016; 22(25): 5761-5768
Published online Jul 7, 2016. doi: 10.3748/wjg.v22.i25.5761
Published online Jul 7, 2016. doi: 10.3748/wjg.v22.i25.5761
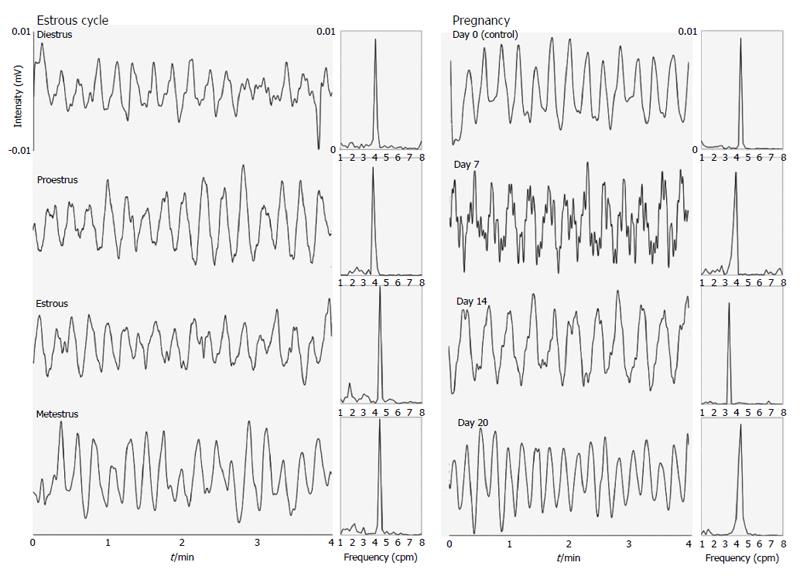
Figure 1 Profile of gastric contractility signals and their respective Fourier transform obtained in female rats during the estrous cycle (estrous phase) and pregnancy (day 14).
The frequency values obtained were 4.3 and 3.6 cpm (71.7 and 60.0 mHz), respectively.
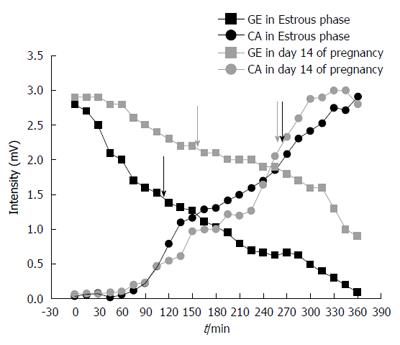
Figure 2 Profile of gastric emptying and cecum arrival obtained in estrous cycle (estrous phase) and pregnancy (day 14).
Arrows indicate the statistical moment (minutes in X-axis), and consequently, mean gastric emptying time and mean cecum arrival time for each example.
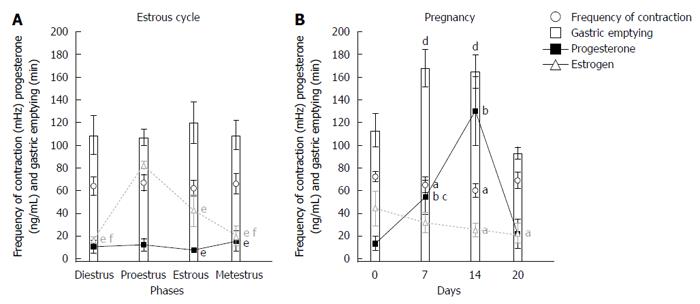
Figure 3 Associations among gastric emptying time (min), frequency of gastric contractions (mHz), and progesterone levels (ng/mL) in female rats during pregnancy and the estrous cycle.
aP < 0.03, compared with control (day 0); bP < 0.002, compared with days 0 and 20; cP < 0.001, compared with day 14; dP < 0.001, compared with days 0 and 20; eP < 0.05, compared with proestrus; fP < 0.001 compared with estrous.
- Citation: Matos JF, Americo MF, Sinzato YK, Volpato GT, Corá LA, Calabresi MFF, Oliveira RB, Damasceno DC, Miranda JRA. Role of sex hormones in gastrointestinal motility in pregnant and non-pregnant rats. World J Gastroenterol 2016; 22(25): 5761-5768
- URL: https://www.wjgnet.com/1007-9327/full/v22/i25/5761.htm
- DOI: https://dx.doi.org/10.3748/wjg.v22.i25.5761


