Copyright
©The Author(s) 2016.
World J Gastroenterol. Jun 28, 2016; 22(24): 5520-5531
Published online Jun 28, 2016. doi: 10.3748/wjg.v22.i24.5520
Published online Jun 28, 2016. doi: 10.3748/wjg.v22.i24.5520
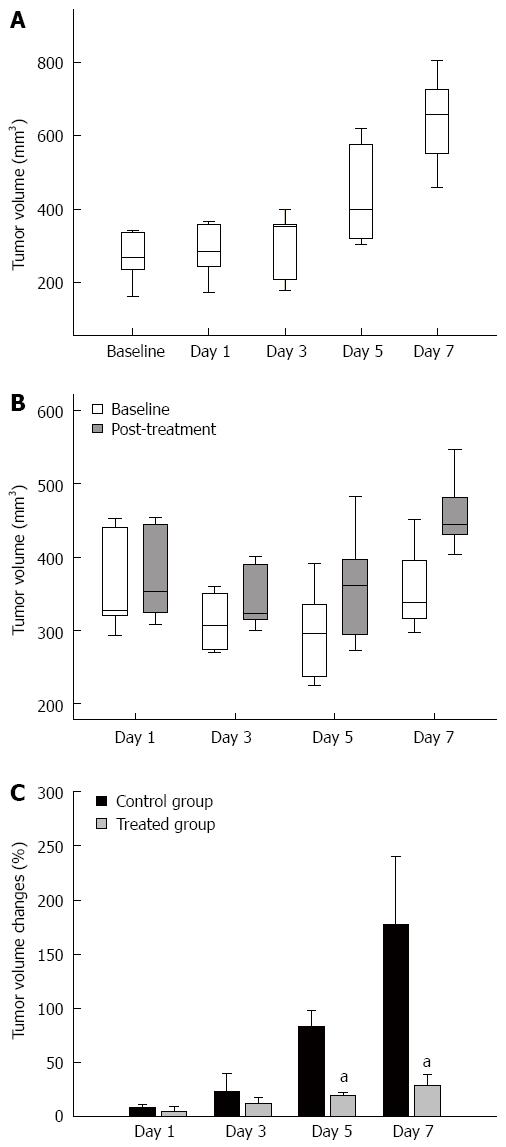
Figure 1 Anti-tumor effects of 5-fluorouracil therapy in mouse gastric cancer xenografts.
A: Actual tumor volume changes in the control group; B: Actual tumor volume changes in the treatment groups; C: The comparison of the change in tumor volumes relative to baseline (day 0) between the control and treatment groups. The control group showed increases in tumor volume, while the treatment group showed as significant tumor growth delay from day 5. Center line = median; upper and lower margins of the box = 25th to the 75th percentile, respectively; whiskers = data from the minimum to the maximum. Error bars denote standard errors. aP < 0.05 vs control group, n = 5 in each group.
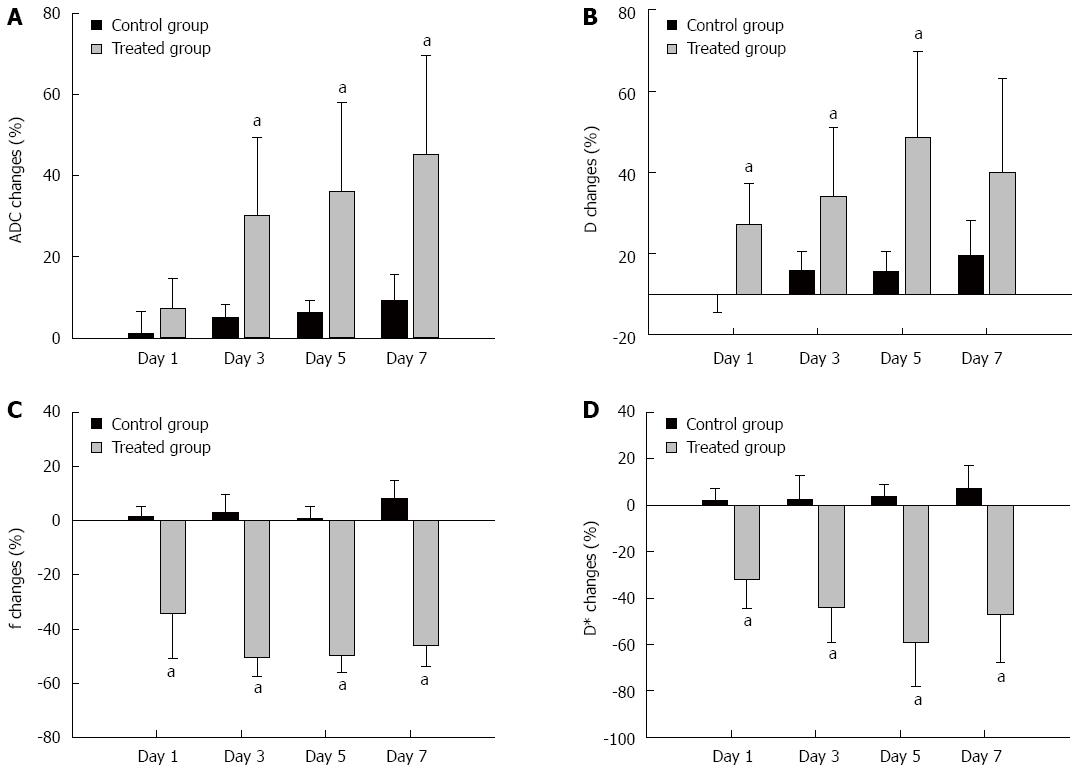
Figure 2 Comparison of the mean percentage changes from baseline in the intravoxel incoherent motion diffusion-weighted imaging derived values between the control (dark) and the 1-, 3-, 5- and 7-d treatment groups (grey).
A: ADC value; B: D value; C: f value; D: D* value. Standard deviations are represented by vertical bars. Relative changes were determined by comparing the values at baseline and those in follow-up. aP < 0.05 vs control. n = 5 in each group. ADC: Apparent diffusion coefficient.
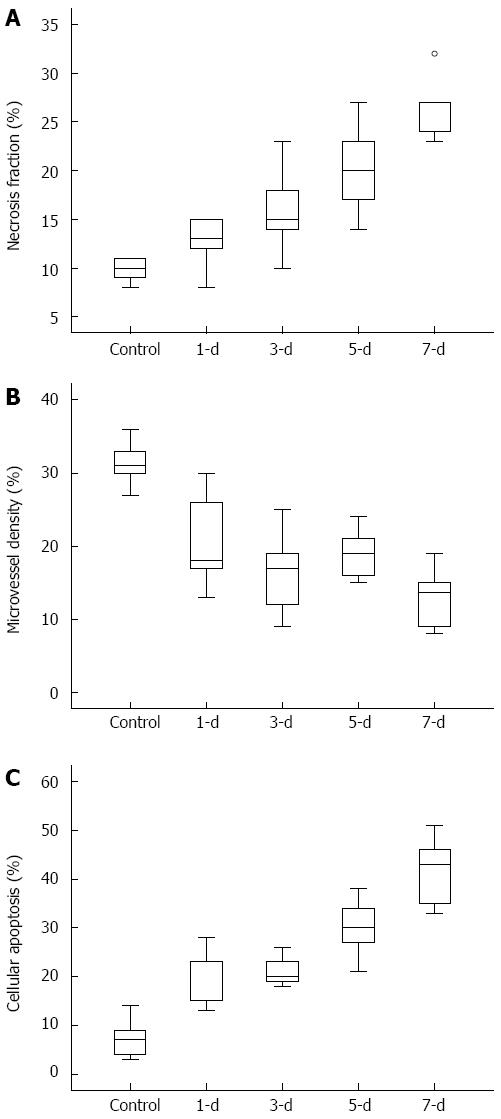
Figure 3 Box-and-Whisker plots show the results of histopathological analysis in the control and the 1-, 3-, 5- and 7-d treatment groups, respectively (n = 5 per group).
A: Necrosis fraction of tumor; B: Microvessel density of tumor; C: Cellular apoptosis of tumor. Center line = median; upper and lower margins of box = 25th to the 75th percentile, respectively; whiskers = data from the minimum to the maximum; ○ = outlier.
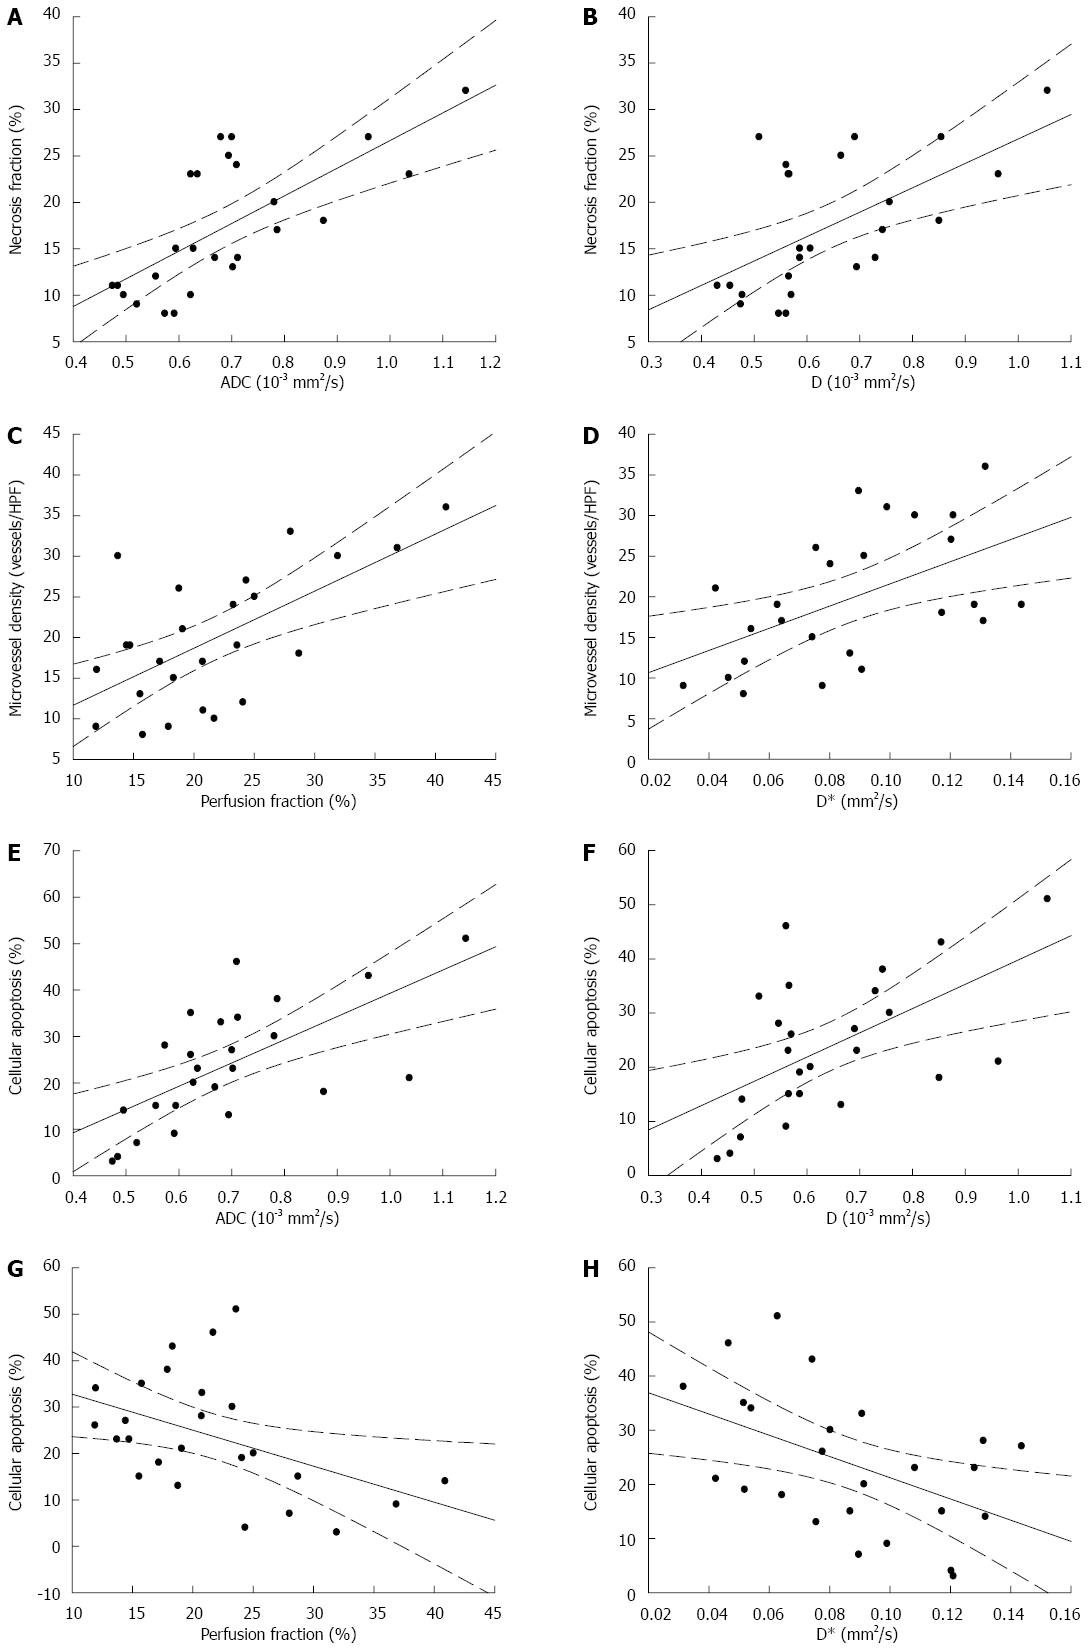
Figure 4 Representative scatter diagrams showing the relationships between intravoxel incoherent motion diffusion-weighted imaging derived parameters and the histological features (n = 25).
A and B: ADC and D were positively correlated with tumor necrosis fraction; C and D: f and D* were positively correlated with microvascular density of tumor; E and F: ADC, D were positively correlated with tumor cellular apoptosis; G and H: f and D* were negatively correlated with tumor cellular apoptosis. P values are shown in Table 2. ADC: Apparent diffusion coefficient.
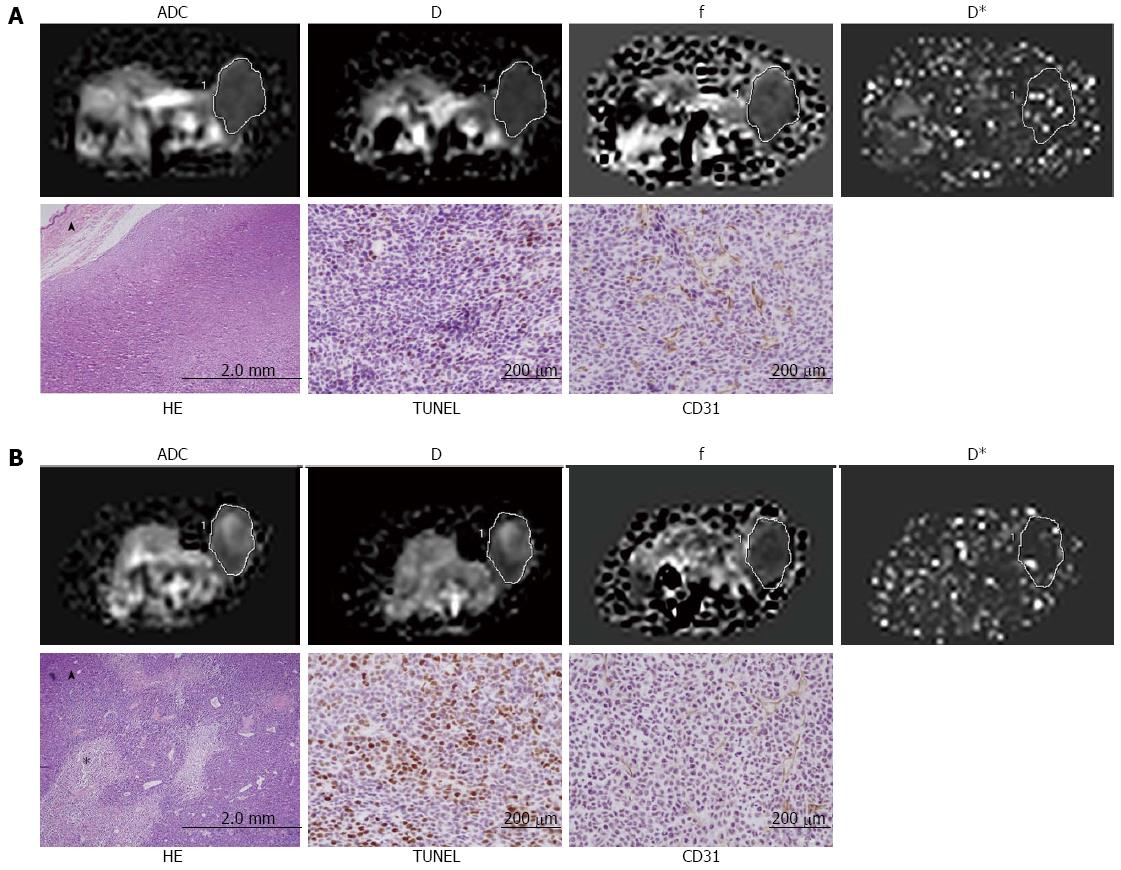
Figure 5 Calculated maps of intravoxel incoherent motion diffusion-weighted imaging parameters and the histopathological images.
A: The lower ADC (0.521 × 10⁻³ mm2/s) and D values (0.475 × 10⁻³ mm2/s) and the higher f (40.92%) and D* (0.131 mm2/s) values, which correspond to low necrosis (10%) and cellular apoptosis (7%) and high MVD (36) in the control group; B: Increased ADC (0.875 × 10⁻³ mm2/s) and D (0.851 × 10⁻³ mm2/s) values and reduced f (17.20%) and D* (0.098 mm2/s) values, which correspond to the increased necrosis (18%) and cellular apoptosis (23%) and decreased MVD (17) in the 3-d treatment group. Note high signal intensity within tumor suggesting necrosis. asterisk means necrosis area; The triangle symbol means skin of the mouse. ADC: Apparent diffusion coefficient; MVD: Microvessel density.
- Citation: Song XL, Kang HK, Jeong GW, Ahn KY, Jeong YY, Kang YJ, Cho HJ, Moon CM. Intravoxel incoherent motion diffusion-weighted imaging for monitoring chemotherapeutic efficacy in gastric cancer. World J Gastroenterol 2016; 22(24): 5520-5531
- URL: https://www.wjgnet.com/1007-9327/full/v22/i24/5520.htm
- DOI: https://dx.doi.org/10.3748/wjg.v22.i24.5520


