Copyright
©The Author(s) 2016.
World J Gastroenterol. Jun 14, 2016; 22(22): 5276-5284
Published online Jun 14, 2016. doi: 10.3748/wjg.v22.i22.5276
Published online Jun 14, 2016. doi: 10.3748/wjg.v22.i22.5276
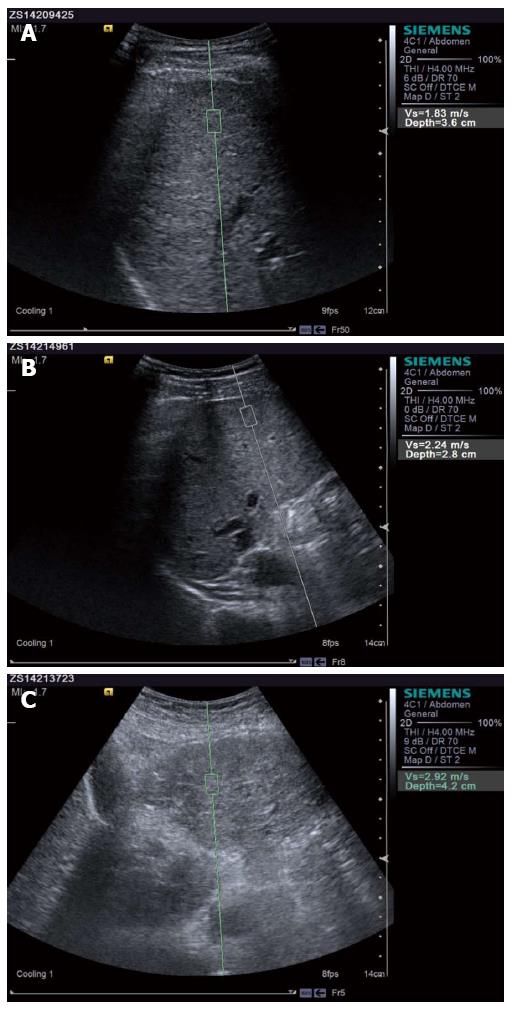
Figure 1 Observation group CP scores in the three classes.
A: CP score patients with cirrhosis (Vs = 1.83 m/s); B: CP score patients with cirrhosis (Vs = 2.24 m/s); C: CP score patients with cirrhosis (Vs = 2.92 m/s).
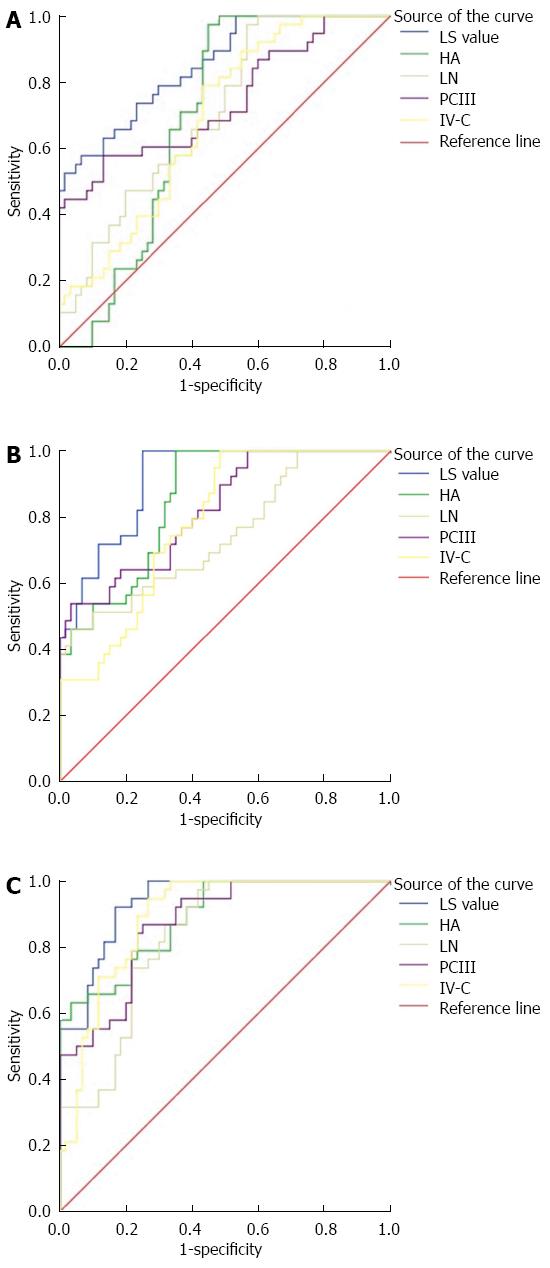
Figure 2 Comparison of the results of CP levels of LS values and the four indicators of liver fibrosis in the ROC curve.
A: CP score for each indicator; B: CP score of the various indicators; C: CP score of the various indicators.
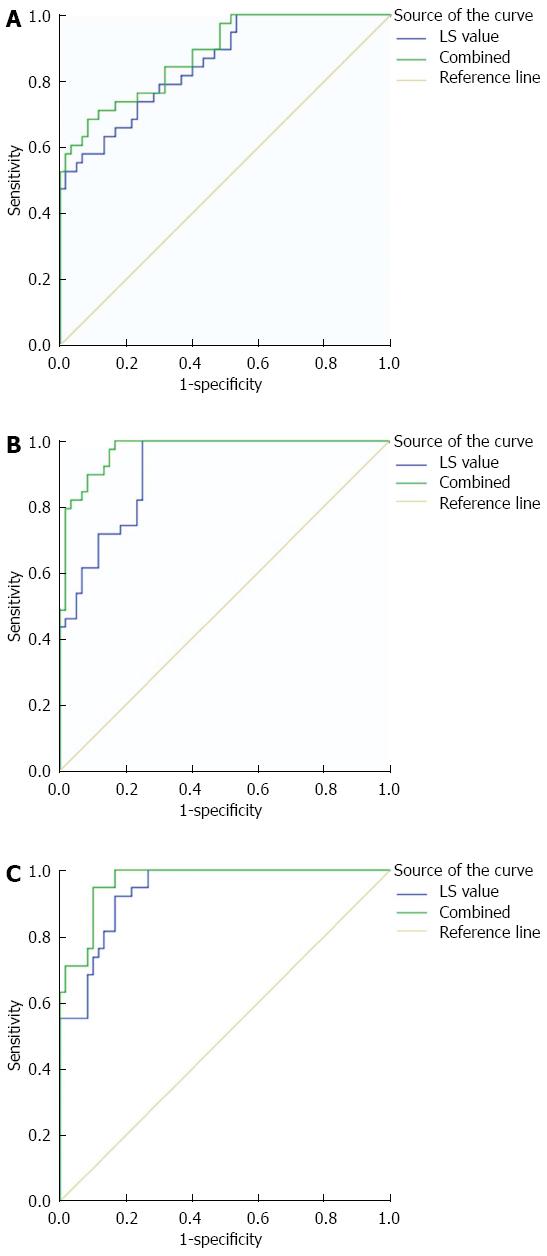
Figure 3 Receiver operating characteristic curve analysis for LS values combined with the four indicators of serum liver fibrosis.
A: CP score of all indicators combined; B: CP score of all indicators combined; C: CP score of all indicators combined.
- Citation: Zhang HC, Hu RF, Zhu T, Tong L, Zhang QQ. Primary biliary cirrhosis degree assessment by acoustic radiation force impulse imaging and hepatic fibrosis indicators. World J Gastroenterol 2016; 22(22): 5276-5284
- URL: https://www.wjgnet.com/1007-9327/full/v22/i22/5276.htm
- DOI: https://dx.doi.org/10.3748/wjg.v22.i22.5276


