Copyright
©The Author(s) 2016.
World J Gastroenterol. Jun 14, 2016; 22(22): 5193-5200
Published online Jun 14, 2016. doi: 10.3748/wjg.v22.i22.5193
Published online Jun 14, 2016. doi: 10.3748/wjg.v22.i22.5193
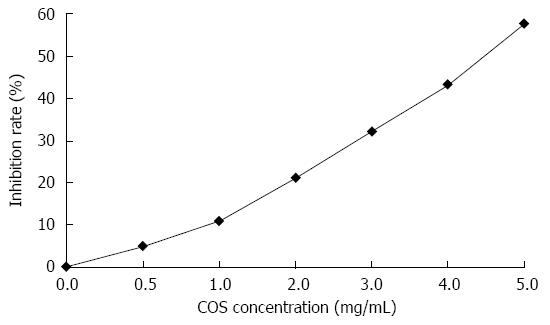
Figure 1 Inhibition curve of chitooligosaccharides for proliferation of SW480 cells.
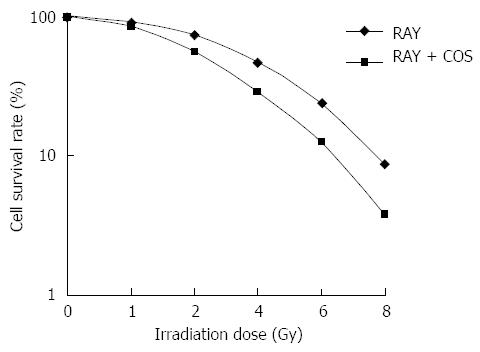
Figure 2 Cells survival rates at different radiation doses between the RAY and RAY + COS groups.
COS: Chitooligosaccharides.
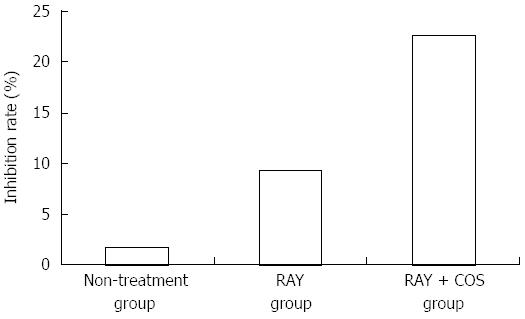
Figure 3 Cell apoptosis comparison between the three groups.
Figure 4 Comparison of cell cycle distribution among the three groups.
A: Non-treatment group; B: RAY group; C: RAY + COS group. COS: Chitooligosaccharides.
- Citation: Han FS, Yang SJ, Lin MB, Chen YQ, Yang P, Xu JM. Chitooligosaccharides promote radiosensitivity in colon cancer line SW480. World J Gastroenterol 2016; 22(22): 5193-5200
- URL: https://www.wjgnet.com/1007-9327/full/v22/i22/5193.htm
- DOI: https://dx.doi.org/10.3748/wjg.v22.i22.5193


