Copyright
©The Author(s) 2016.
World J Gastroenterol. Jun 7, 2016; 22(21): 5104-5113
Published online Jun 7, 2016. doi: 10.3748/wjg.v22.i21.5104
Published online Jun 7, 2016. doi: 10.3748/wjg.v22.i21.5104
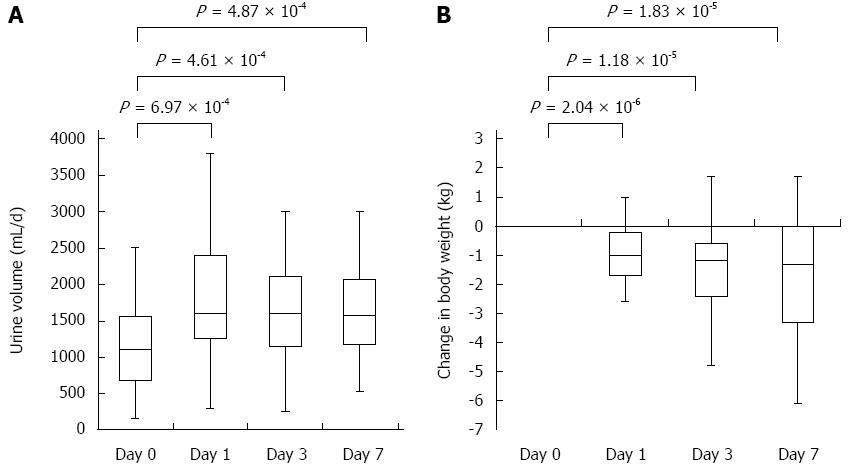
Figure 1 Effects of tolvaptan on liquid retention in all of the patients included in this study.
A: Box and whisker plots of daily urine volumes during the first week of tolvaptan administration in all of the patients. Median values were 1108 mL, 1600 mL, 1500 mL and 1582 mL on day 0, 1, 3 and 7, respectively; B: Box and whisker plots of changes in body weight from baseline during the first week of tolvaptan administration in all of the patients. Median changes in body weight were -1 kg, -1.2 kg, and -1.3 kg on day 1, 3 and 7, respectively. Difference between day 0 (= baseline) and day1, 3 and 7 were compared by using Wilcoxon signed rank test.
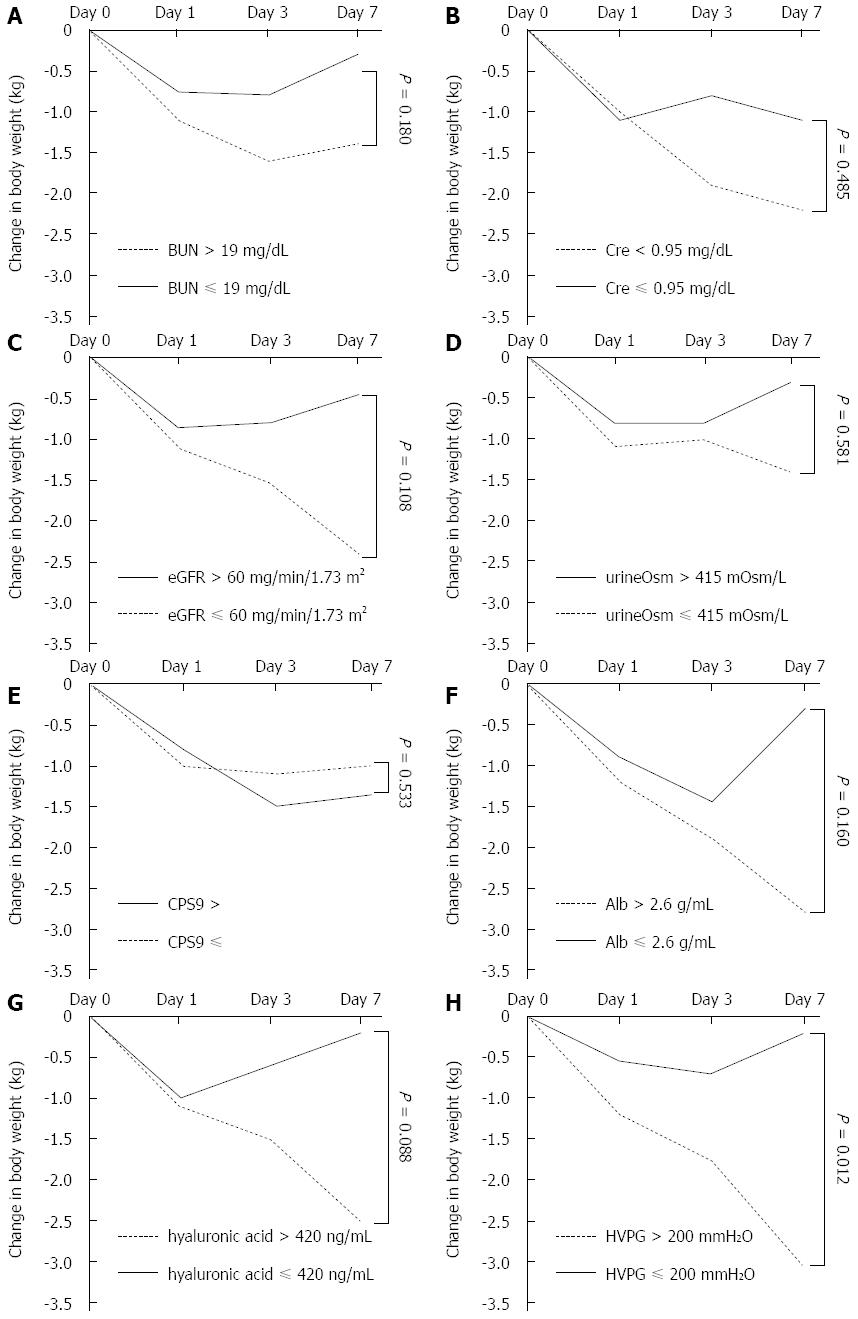
Figure 2 Change in body weight from baseline on each baseline factor during the first week of tolvaptan administration.
Data are expressed as median. Patients were divided into two groups using the median value of each baseline variable: (A) serum BUN; (B) serum creatinine; (C) serum eGFR; (D) urine osmolality; (E) Child-Pugh Score (CPS); (F) serum albumin (Alb); (G) serum hyaluronic acid; and (H) Hepatic venous pressure gradient (HVPG).
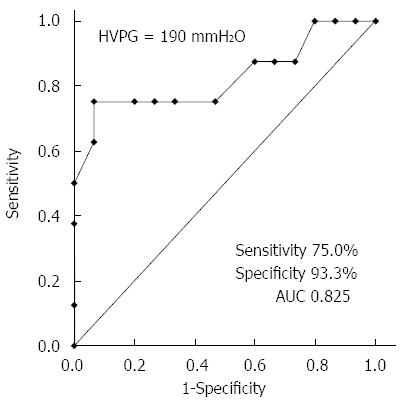
Figure 3 Optimal cutoff value of hepatic venous pressure gradient of the efficacy assessment was determined using ROC curve.
The value of 190 mmH2O [sensitivity, 75.0%; specificity, 93.3%; and area under the curve (AUC), 0.825] was the most useful in predicting treatment response, defined as body weight loss of 2 kg or greater from the baseline. HVPG: Hepatic venous pressure gradient.
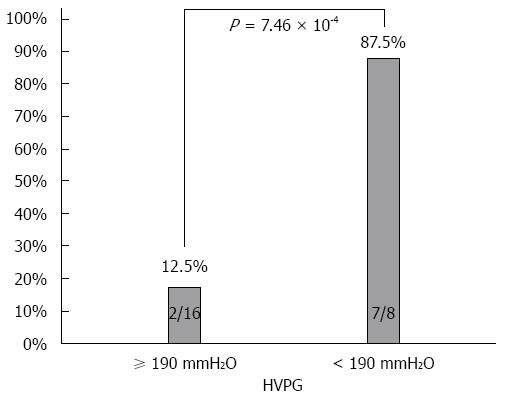
Figure 4 Difference in treatment response rates between patients with low and high hepatic venous pressure gradient.
The response rate of 87.5% in the latter with 190 mmH2O or greater was significantly higher than that of 12.5% in the former with less than 190 mmH2O (P = 7.46 × 10⁻⁴). HVPG: Hepatic venous pressure gradient.
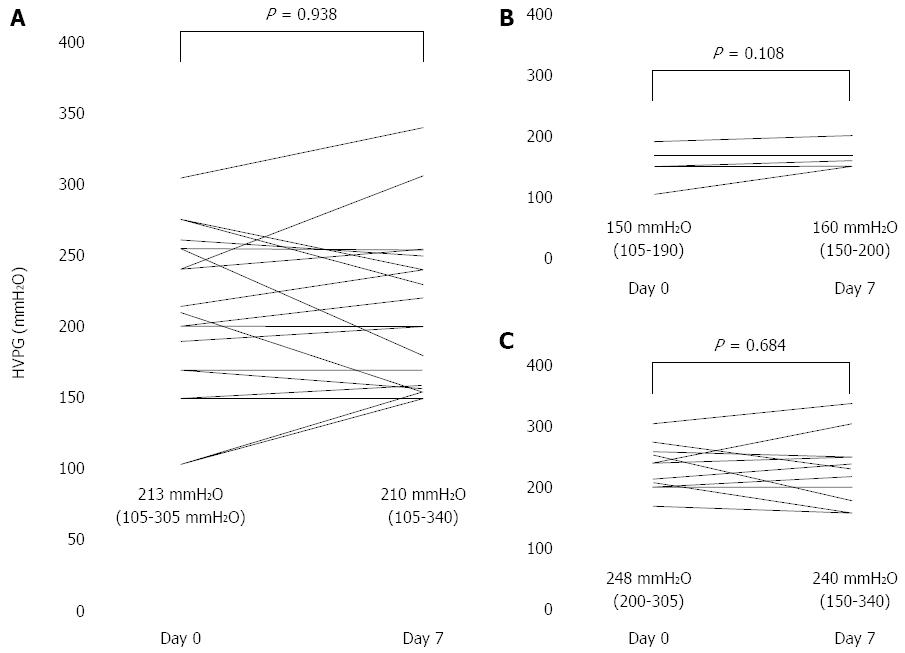
Figure 5 Changes in hepatic venous pressure gradient levels at day 0 and 7.
Data are expressed as median (range in parenthesis). A: Overall patients (n = 19); B: Patients (n = 7) with low HVPG (≤ 190 mmH2O); C: Patients (n = 12) with high HVPG (> 190 mmH2O). There was not significant difference in any groups, indicating that tolvaptan had little impact on HVPG. HVPG: Hepatic venous pressure gradient.
- Citation: Nakagawa A, Atsukawa M, Tsubota A, Kondo C, Okubo T, Arai T, Itokawa N, Narahara Y, Iwakiri K. Usefulness of portal vein pressure for predicting the effects of tolvaptan in cirrhotic patients. World J Gastroenterol 2016; 22(21): 5104-5113
- URL: https://www.wjgnet.com/1007-9327/full/v22/i21/5104.htm
- DOI: https://dx.doi.org/10.3748/wjg.v22.i21.5104


