Copyright
©The Author(s) 2016.
World J Gastroenterol. May 28, 2016; 22(20): 4908-4917
Published online May 28, 2016. doi: 10.3748/wjg.v22.i20.4908
Published online May 28, 2016. doi: 10.3748/wjg.v22.i20.4908
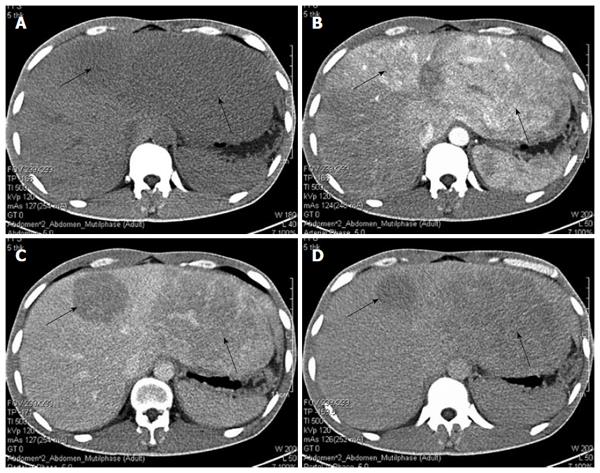
Figure 1 Computed tomography manifestation of the male patient.
A: Low-density masses in the plain phase (black arrows); B: In the arterial phase, a strong contrast-enhancing effect with low-density in center was observed; C: In the portal phase, tumors had almost washed out the contrast agent, but a weak contrast-enhancing effect was sustained; D: Low-density masses in the delayed phase.
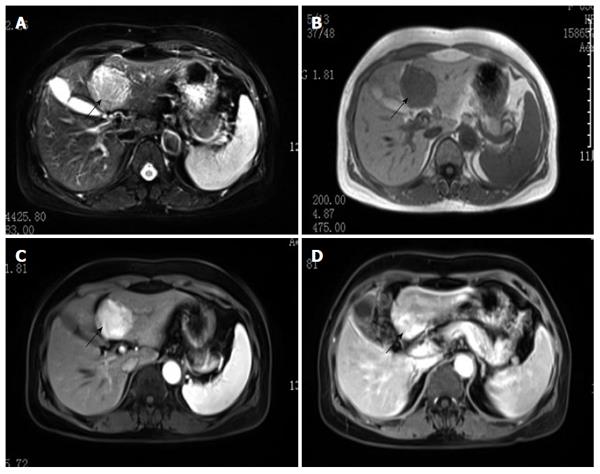
Figure 2 Magnetic resonance imaging manifestation of the female patient.
The tumor had clear boundaries and showed high signal on T2WI (A, black arrow) and low signal in the plain phase (B); Hyperenhancement in the arterial phase (C) and delayed phase (D).
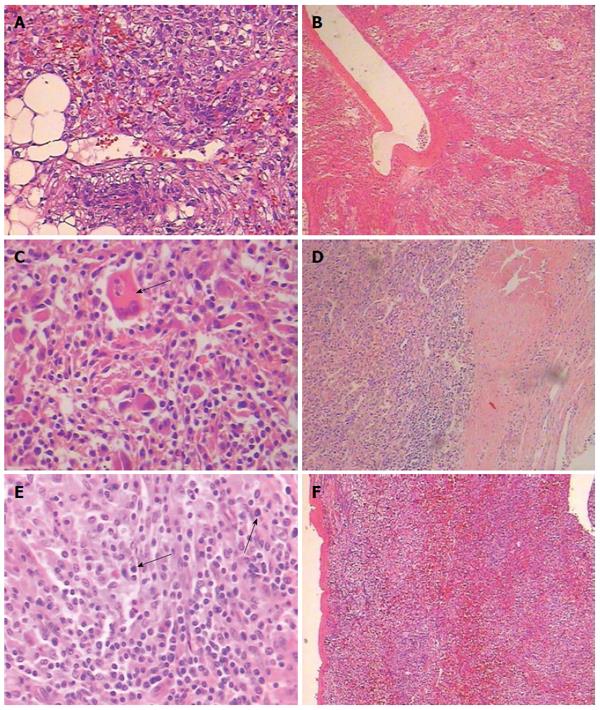
Figure 3 Histology of hepatic epithelioid angiomyolipoma.
A: The tumor comprised of sheets of large polygonal cells with abundant granular eosinophilic cytoplasm (HE, × 200); B: The tumor cells were arranged radial around blood vessels (HE, × 40); Microscopic features signifying aggressive behavior were observed: C: Cytologic atypia (black arrow) (HE, × 200); D: Coagulative necrosis (HE, × 40); E: Increased mitotic count (black arrow) (HE, × 200); F: Tumors mainly consisted of epitheli¬oid cells that comprised approximately 95% of the total neoplastic mass (HE, × 40).
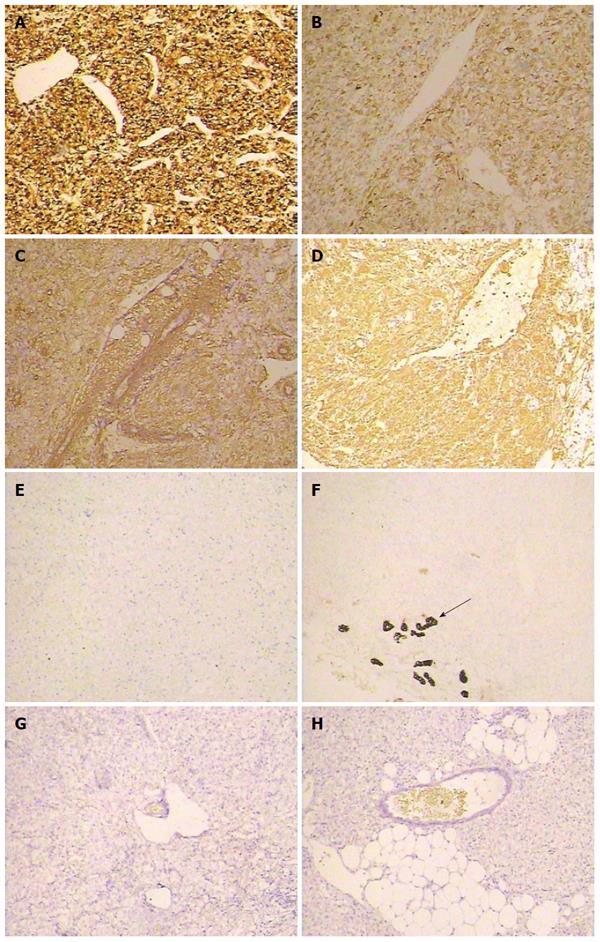
Figure 4 Immunohistochemical staining of hepatic epithelioid angiomyolipoma.
The tumor cells were positive for melanocytic markers HMB-45 (A, × 40), Melan-A (B, × 40), SMA (C, × 40), and VIM (D, × 40), but negative for S-100 (E, × 40), CK (the arrow indicates the bile duct epithelium) (F, × 40), AFP (G, × 40), and Herpar-1 (H, × 40).
- Citation: Liu J, Zhang CW, Hong DF, Tao R, Chen Y, Shang MJ, Zhang YH. Primary hepatic epithelioid angiomyolipoma: A malignant potential tumor which should be recognized. World J Gastroenterol 2016; 22(20): 4908-4917
- URL: https://www.wjgnet.com/1007-9327/full/v22/i20/4908.htm
- DOI: https://dx.doi.org/10.3748/wjg.v22.i20.4908


