Copyright
©The Author(s) 2016.
World J Gastroenterol. May 28, 2016; 22(20): 4835-4847
Published online May 28, 2016. doi: 10.3748/wjg.v22.i20.4835
Published online May 28, 2016. doi: 10.3748/wjg.v22.i20.4835
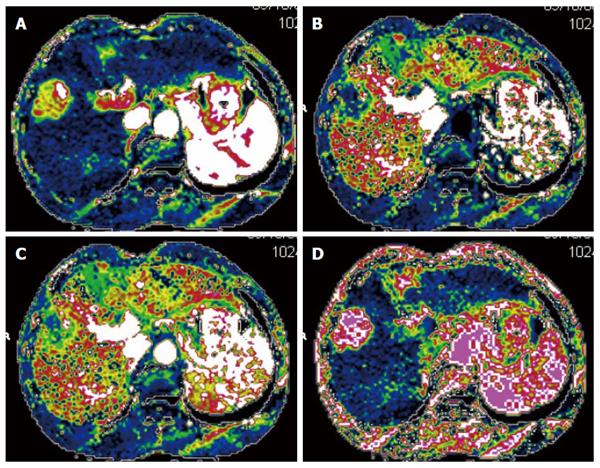
Figure 1 Seventy-year-old male patient with hepatocellular carcinoma.
Axial perfusion images of the tumor before transarterial chemoembolization were created by maximum slope method. The tumor showed an increased hepatic arterial perfusion and decreased hepatic portal perfusion compared with the normal parenchyma. The values of hepatic arterial perfusion, hepatic portal perfusion, total liver perfusion and hepatic arterial perfusion index were 0.512 mL/min.mL, 0.226 mL/min.mL, 0.738 mL/min.mL and 69.4%, respectively. A: Image of hepatic arterial perfusion; B: Image of hepatic portal perfusion; C: Image of total liver perfusion; D: Image of hepatic arterial perfusion index.
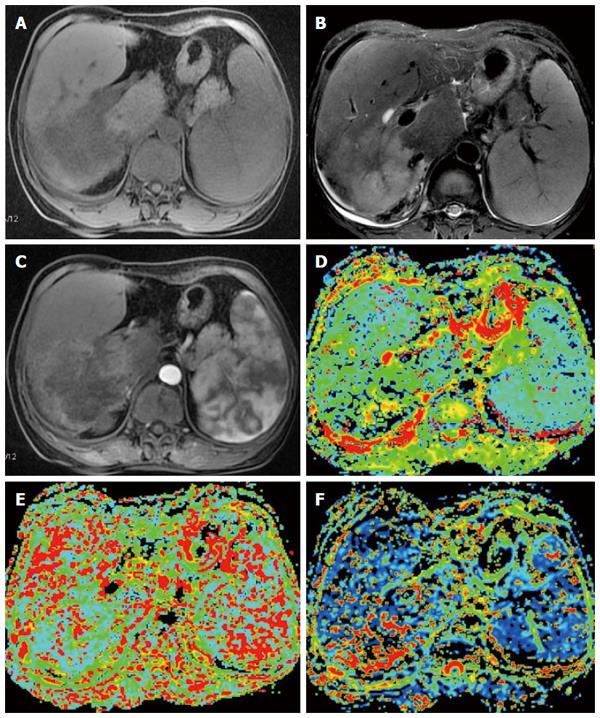
Figure 2 Fifty-three-year-old female patient with hepatocellular carcinoma in the right lobe of the liver.
A: Axial T1-weighted image shows a hypointense mass lesion; B: Axial T2-weighted image shows a hyperintense mass lesion; C: Contrast-enhanced MRI during the arterial phase showing lesion enhancement; D: Mapping of the estimated value of the D parameter. The average value in the lesion ROI was D = 1.22 × 10⁻³ mm2/s; E: Mapping of the estimated value of the D* parameter. The average value in the lesion ROI was D* = 20.6 × 10⁻³ mm2/s; F: Mapping of the perfusion fraction (f) with a value of 19.6%.
- Citation: Yang K, Zhang XM, Yang L, Xu H, Peng J. Advanced imaging techniques in the therapeutic response of transarterial chemoembolization for hepatocellular carcinoma. World J Gastroenterol 2016; 22(20): 4835-4847
- URL: https://www.wjgnet.com/1007-9327/full/v22/i20/4835.htm
- DOI: https://dx.doi.org/10.3748/wjg.v22.i20.4835


