Copyright
©The Author(s) 2016.
World J Gastroenterol. May 14, 2016; 22(18): 4594-4603
Published online May 14, 2016. doi: 10.3748/wjg.v22.i18.4594
Published online May 14, 2016. doi: 10.3748/wjg.v22.i18.4594
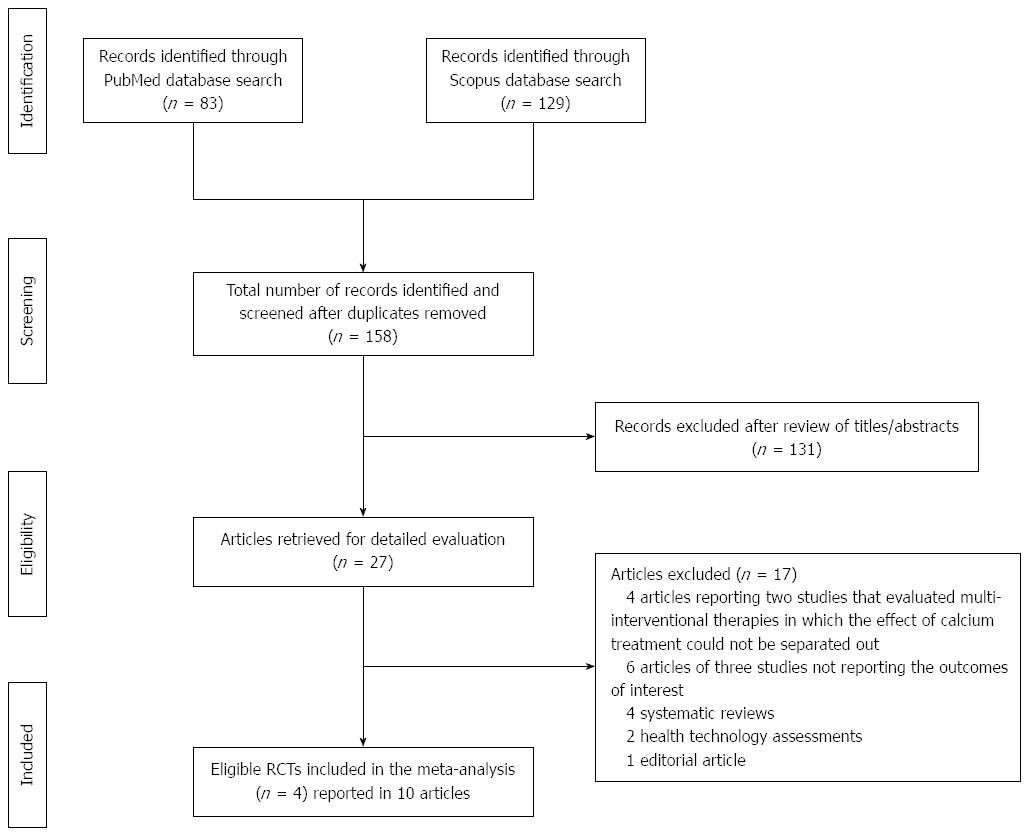
Figure 1 Summary of the evidence search and selection process (flow diagram).
RCTs: Randomized controlled trials.
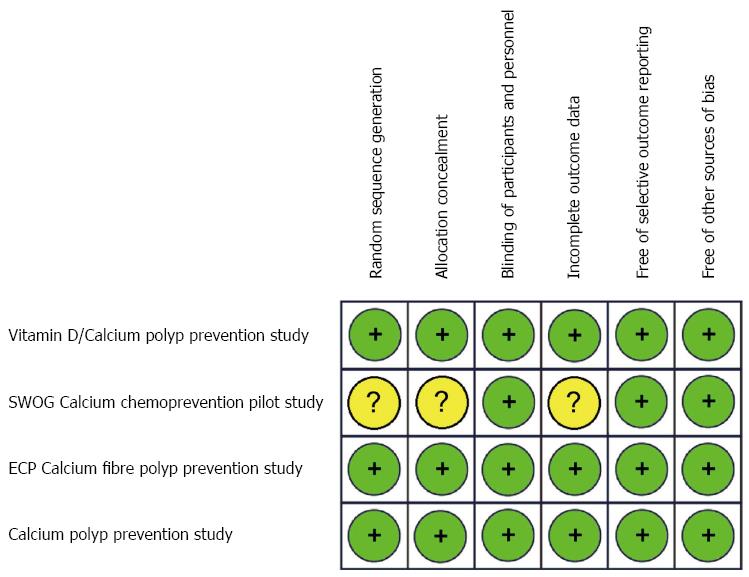
Figure 2 Risk-of-bias assessment for the studies included in the meta-analysis.
Green (+): Low risk-of-bias; Yellow (?): Unclear risk-of-bias. ECP: European Cancer Prevention Organisation; SWOG: Southwest Oncology Group.
Figure 3 Forest plot for adenomas: results from individual studies and meta-analysis.
For the analysis we used intention-to-treat data for patients who underwent follow-up evaluation (follow-up colonoscopies). ECP: European Cancer Prevention Organisation; SWOG: Southwest Oncology Group; n: Number of subjects with at least one adenoma detected during the follow-up evaluation; N: Number of subjects who underwent follow-up evaluation; RR: Risk ratio.
Figure 4 Forest plot for advanced adenomas: results from individual studies and meta-analysis.
For the analysis we used intention-to-treat data for patients who underwent follow-up evaluation (follow-up colonoscopies). ECP: European Cancer Prevention Organisation; SWOG: Southwest Oncology Group; n: Number of subjects with at least one adenoma detected during the follow-up evaluation; N: Number of subjects who underwent follow-up evaluation; RR: Risk ratio.
- Citation: Bonovas S, Fiorino G, Lytras T, Malesci A, Danese S. Calcium supplementation for the prevention of colorectal adenomas: A systematic review and meta-analysis of randomized controlled trials. World J Gastroenterol 2016; 22(18): 4594-4603
- URL: https://www.wjgnet.com/1007-9327/full/v22/i18/4594.htm
- DOI: https://dx.doi.org/10.3748/wjg.v22.i18.4594


