Copyright
©The Author(s) 2016.
World J Gastroenterol. Apr 21, 2016; 22(15): 4034-4040
Published online Apr 21, 2016. doi: 10.3748/wjg.v22.i15.4034
Published online Apr 21, 2016. doi: 10.3748/wjg.v22.i15.4034
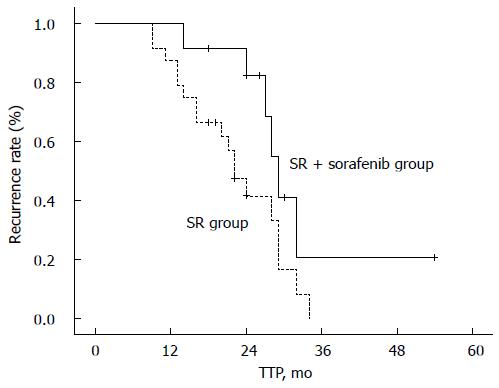
Figure 1 Kaplan-Meier curve of time-to-progression in the surgical resection + sorafenib and surgical resection groups.
The median time to progression (TTP) was estimated from the patients with equivalent as 0.5 and derived as 29 mo (95%CI: 26.5-31.5 mo) and 22 mo (95%CI: 18.0-26.0 mo) for surgical resection (SR) + sorafenib and SR groups, respectively. + indicates censored patients. The log-rank test showed a significant difference in the TTP between groups (P = 0.041).
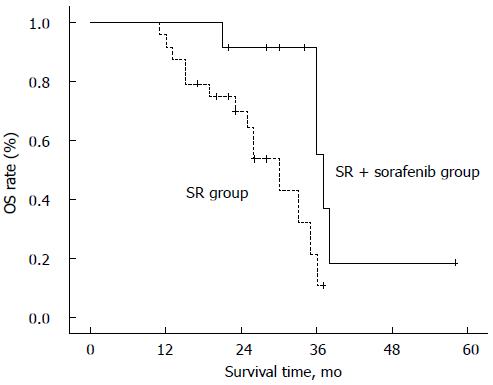
Figure 2 Kaplan-Meier curve of overall survival times in the surgical resection + sorafenib and surgical resection groups.
The median overall survival (OS) time was estimated from the patients with equivalent as 0.5 and derived as 37 mo (95%CI: 34.8-39.2 mo) and 30 mo (95%CI: 24.1-36.0 mo) for the surgical resection (SR) + sorafenib and SR groups, respectively. + indicates censored patients. The log-rank test showed a significant difference in the OS times between groups (P = 0.010).
- Citation: Li J, Hou Y, Cai XB, Liu B. Sorafenib after resection improves the outcome of BCLC stage C hepatocellular carcinoma. World J Gastroenterol 2016; 22(15): 4034-4040
- URL: https://www.wjgnet.com/1007-9327/full/v22/i15/4034.htm
- DOI: https://dx.doi.org/10.3748/wjg.v22.i15.4034


