Copyright
©The Author(s) 2016.
World J Gastroenterol. Apr 21, 2016; 22(15): 4009-4019
Published online Apr 21, 2016. doi: 10.3748/wjg.v22.i15.4009
Published online Apr 21, 2016. doi: 10.3748/wjg.v22.i15.4009
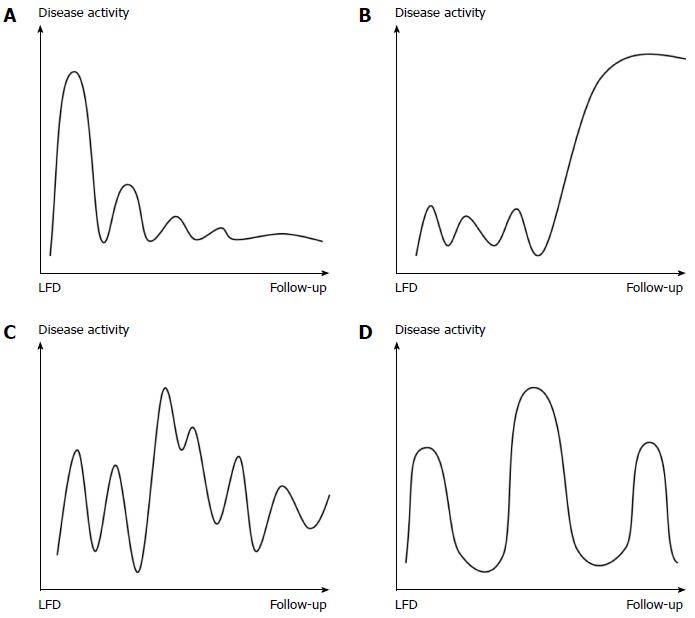
Figure 1 Copenhagen irritable bowel syndrome disease courses.
The four figures each depict a different type of IBS disease course with varying disease activity over time. The time span is from introduction of the LFD until follow-up. The same figures were used from time of diagnosis to introduction of the LFD (not shown). A: Mild IBS with indolent course: The disease activity fades over time; B: Mild IBS with aggressive course: The disease activity increases over time; C: Chronic IBS with continuous course: There is constant disease activity without remission periods; D: Chronic IBS with intermittent course: The disease activity appears in relapses with remission periods in between. LFD: Low FODMAP diet; IBS: Irritable bowel syndrome.
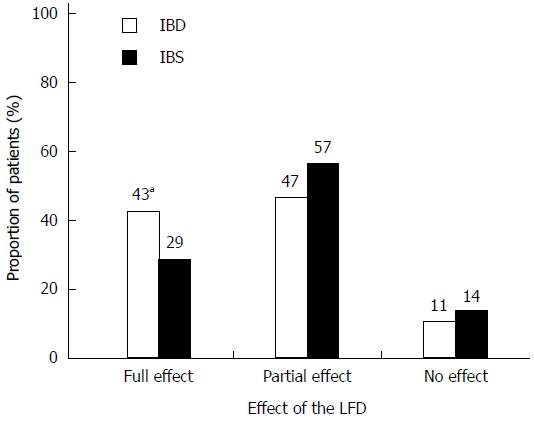
Figure 2 Patient-reported effectiveness of the low FODMAP diet in inflammatory bowel disease and irritable bowel syndrome patients at follow-up.
Effectiveness was categorised as full, partial, or no effect. There were more IBD patients with full effect than IBS patients (aP = 0.08). IBD: n = 47; IBS: n = 126. LFD: Low FODMAP diet; IBD: Inflammatory bowel disease; IBS: Irritable bowel syndrome.
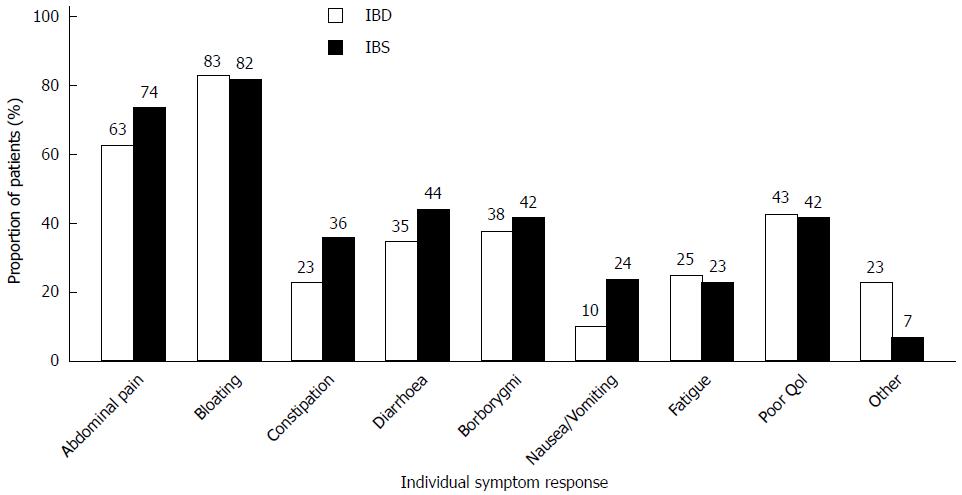
Figure 3 Patient-reported symptom relief for individual symptoms.
Patients were able to select as many symptoms as they felt appropriate according to subjective symptom improvement following LFD treatment. The majority experienced relief of abdominal pain and bloating. IBD: n = 40; IBS: n =113. QoL: Quality of life; IBD: Inflammatory bowel disease; IBS: Irritable bowel syndrome.
Figure 4 Changes in Copenhagen IBS disease courses after low FODMAP diet treatment.
The four different disease courses are depicted before and after the LFD intervention for the IBD and IBS group, separately. Above each figure, the prevalence is denoted as a percentage. The mild indolent course increased significantly following LFD introduction in both patient groups (P < 0.001), while the chronic continuous course and the intermittent course were less common at follow-up. IBD: n = 43; IBS: n = 120. LFD: Low FODMAP diet; IBS: Irritable bowel syndrome; IBD: Inflammatory bowel disease.
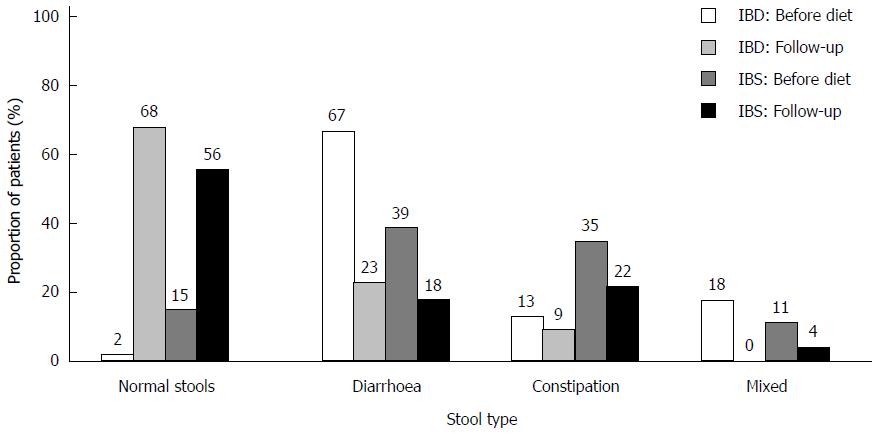
Figure 5 Changes in stool type after low FODMAP diet treatment.
The stool types (Bristol stool chart) was categorised as normal stools, diarrhoea, constipation, and mixed. After the LFD, there was a significant increase in the prevalence of normal stools in both IBD and IBS patients (P < 0.001) with decreases in the remaining three categories of stool type, in particular the diarrhoea group (P < 0.001). IBD: n = 43; IBS: n = 121. LFD: Low FODMAP diet; IBS: Irritable bowel syndrome; IBD: Inflammatory bowel disease.
- Citation: Maagaard L, Ankersen DV, Végh Z, Burisch J, Jensen L, Pedersen N, Munkholm P. Follow-up of patients with functional bowel symptoms treated with a low FODMAP diet. World J Gastroenterol 2016; 22(15): 4009-4019
- URL: https://www.wjgnet.com/1007-9327/full/v22/i15/4009.htm
- DOI: https://dx.doi.org/10.3748/wjg.v22.i15.4009


