Copyright
©The Author(s) 2016.
World J Gastroenterol. Apr 21, 2016; 22(15): 3962-3968
Published online Apr 21, 2016. doi: 10.3748/wjg.v22.i15.3962
Published online Apr 21, 2016. doi: 10.3748/wjg.v22.i15.3962
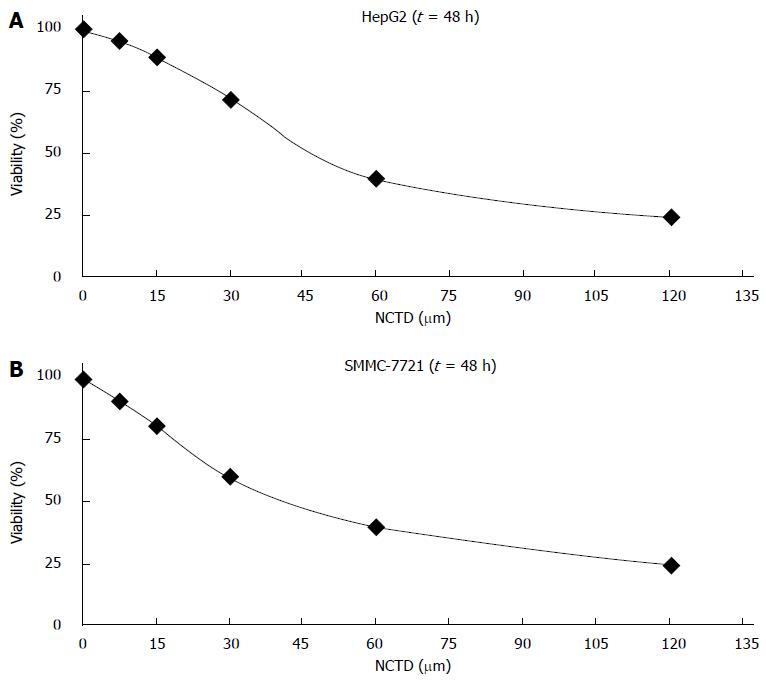
Figure 1 Change in cell proliferation inhibition rate after 48 h of treatment with different concentrations of norcantharidin.
A: The change of cell proliferation inhibition rate in HepG2 cells; B: The change of cell proliferation inhibition rate in SMMC-7721 cells.
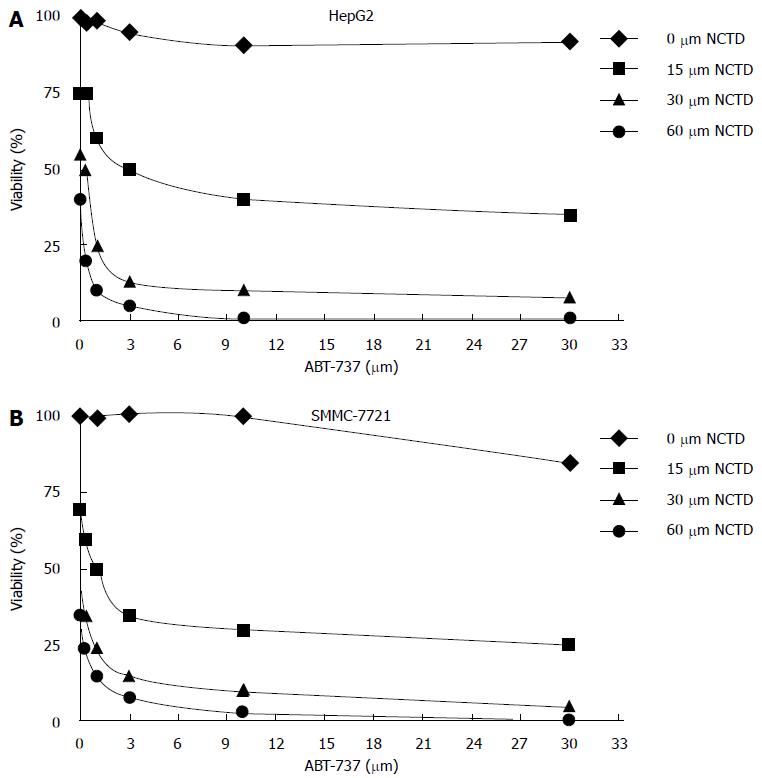
Figure 2 Change in cell proliferation inhibition rate after 48 h of treatment with different concentrations of ABT-737 or with ABT-737 combined with different concentrations of norcantharidin (15 μm, 30 μm, 60 μm).
A: The change of cell proliferation inhibition rate in HepG2 cells; B: The change of cell proliferation inhibition rate in SMMC-7721 cells.
Figure 3 Expression of Mcl-1 in cells after treatment with different concentrations of norcantharidin.
Figure 4 Expression of cytochrome C in HepG2 cells and SMMC-7721 cells after treatment with ABT-737 and norcantharidin detected by Western blotting.
A: The expression of cytochrome C in HepG2 cells; B: The expression of cytochrome C in SMMC-7721 cells.
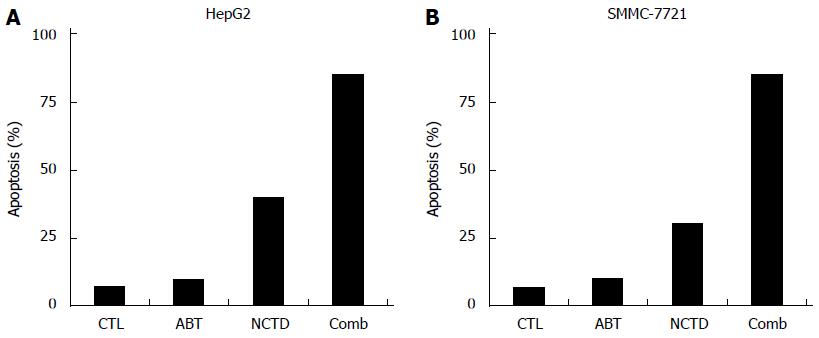
Figure 5 Apoptosis of HepG2 and SMMC-7721 cells detected by flow cytometry after treatment for 48 h.
A: The apoptosis of HepG2 cells after treatment for 48 h; B: The apoptosis of SMMC-7721 cells after treatment for 48 h.
- Citation: Ren J, Li G, Zhao W, Lin L, Ye T. Norcantharidin combined with ABT-737 for hepatocellular carcinoma: Therapeutic effects and molecular mechanisms. World J Gastroenterol 2016; 22(15): 3962-3968
- URL: https://www.wjgnet.com/1007-9327/full/v22/i15/3962.htm
- DOI: https://dx.doi.org/10.3748/wjg.v22.i15.3962


