Copyright
©The Author(s) 2016.
World J Gastroenterol. Apr 14, 2016; 22(14): 3746-3757
Published online Apr 14, 2016. doi: 10.3748/wjg.v22.i14.3746
Published online Apr 14, 2016. doi: 10.3748/wjg.v22.i14.3746
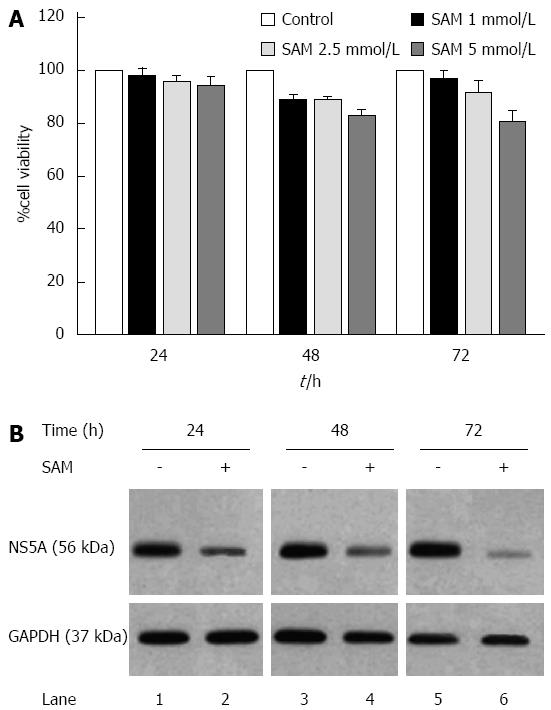
Figure 1 Effect of S-adenosyl-L-methionine in hepatitis C virus expression and cell viability.
A: Cell viability in HCV-replicon cells exposed to SAM. Huh7 HCV replicon cells were treated with SAM at indicated concentrations for 24, 48 and 72 h. Cell viability was then determined by MTT assay and the % viability was calculated by comparing the different conditions with untreated cells (100% viability); B: HCV NS5A protein levels in Huh7 HCV replicon cells treated with SAM. Huh7 HCV replicon cells (2 × 10⁵ cells) were incubated with SAM 1 mmol/L. Cell lysates were prepared, and equal amounts of protein extracts (30 μg) were subjected to immunoblot analysis to detect NS5A. GAPDH was used as a control. SAM: S-adenosyl-L-methionine; HCV: Hepatitis C virus.
Figure 2 Synergic antiviral effect of S-adenosyl-L-methionine plus standard interferon treatment.
A: Effect of SAM and PEG-IFN + RBV on HCV-RNA levels. Huh7 HCV replicon cells (2 × 10⁵ cells) were incubated with 1 mmol/L SAM alone or SAM plus PEG-IFN (1000 UI/mL) and RBV (50 μmol/L). Cells were harvested at 24, 48 and 72 h and HCV-RNA levels were quantified by real-time RT-PCR and normalized with GAPDH and RPS18 using delta delta Ct method. Mean results from three independent experiments are shown. bP≤ 0.01 comparison of SAM vs untreated cells; dP≤ 0.01 comparison of SAM + PEG-IFN + RBV vs untreated cells; B: HCV NS5A protein levels in Huh7 HCV replicon cells treated with SAM PEG-IFN + RBV. Huh7 HCV replicon cells (2 × 10⁵) cells were incubated with 1 mmol/L SAM alone or SAM plus PEG-IFN (1000 UI/mL) and RBV (50 μmol/L). Cell lysates were prepared, and equal amounts of protein extracts (40 μg) were subjected to immunoblot analysis to detect NS5A and actin levels. The ratios of NS5A and actin were quantified with ImageJ 1.46r 2011 software, means of three blots are represented in the graphic. bP≤ 0.01 comparison of SAM vs untreated cells; dP≤ 0.01 comparison of SAM + PEG-IFN + RBV vs untreated cells; C: Huh7 HCV replicon cells (1.5 × 10⁴ cells) were incubated with 1 mmol/L SAM alone, or SAM plus PEG-IFN (1000 UI/mL) and RBV (50 μmol/L). Cells were harvested at 24, 48 and 72 h and total proteins were obtained. Cell lysates were prepared, and equal amounts of protein extracts (40 μg) were subjected to immunoblot analysis to detect STAT1, PKR and actin levels. SAM: S-adenosyl-L-methionine; HCV: Hepatitis C virus; IFN: Interferon; RBV: Ribavirin.
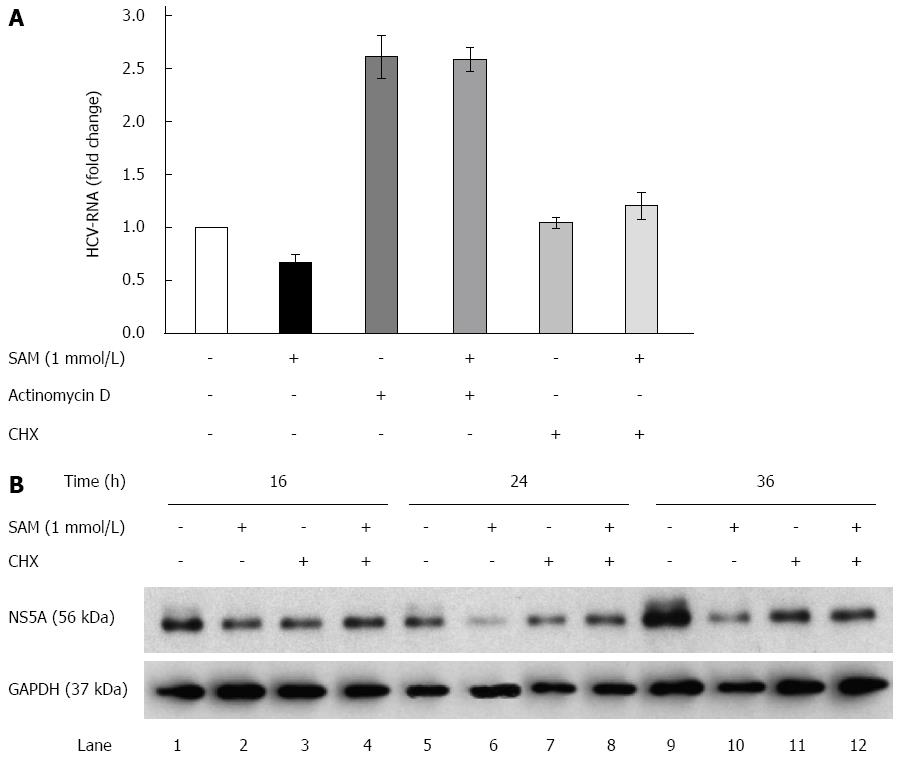
Figure 3 Role of actinomycin D and cycloheximide on the antiviral effect of S-adenosyl-L-methionine.
A: SAM decreases replicon RNA levels without affecting its stability. Huh7 HCV replicon cells (1.5 × 10⁵ cells) were incubated with SAM 1 mmol/L, some cells were treated with actinomycin D (4 μg/mL) or CHX (50 μg/mL) for 2 h, then SAM was added. Cells were harvested 16 h later and HCV-RNA levels were quantified by real-time RT-PCR and normalized with GAPDH using ΔΔCt method. Mean results from three experiments are shown; B: CHX partially reverts the downregulated NS5A protein expression induced by SAM. Huh7 HCV replicon cells (1.5 × 10⁵ cells) were incubated with SAM 1 mmol/L, some cells were treated CHX (50 μg/mL) after 4 h of SAM treatment. Cells were harvested at different time points (0-36 h), then total protein was extracted and western blot for NS5A and GAPDH was performed. CHX: Cycloheximide; SAM: S-adenosyl-L-methionine; HCV: Hepatitis C virus.
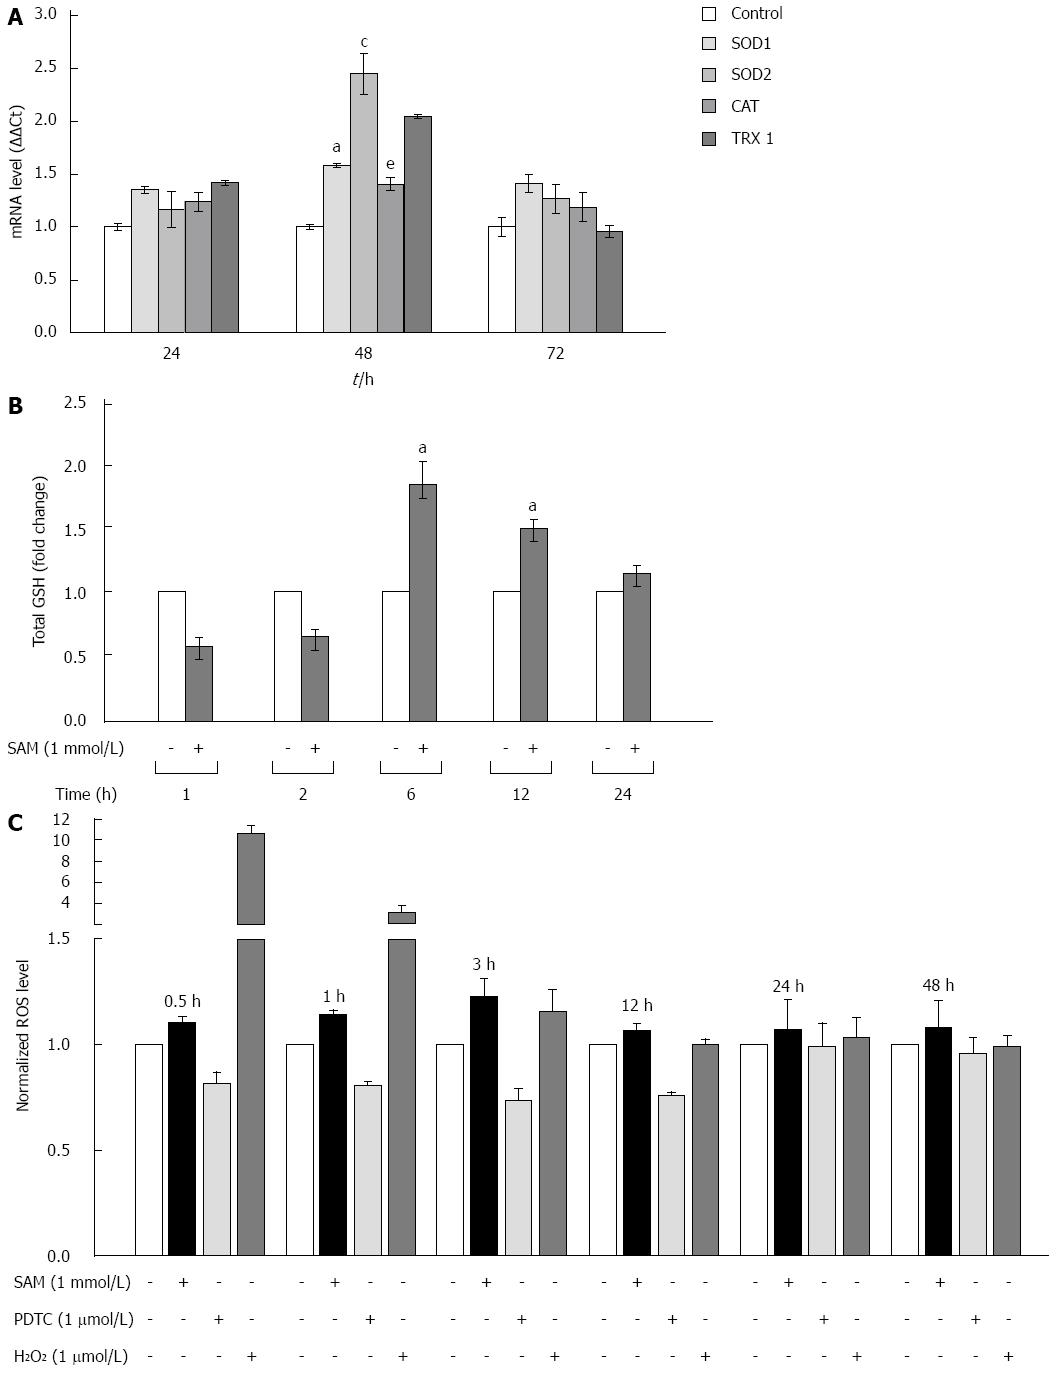
Figure 4 Effect of S-adenosyl-L-methionine exposition on oxidative stress markers.
A: Effect of SAM on antioxidant enzyme expression. Huh7 HCV replicon cells (2 × 10⁵ cells) were incubated with 1 mmol/L SAM and then cells were harvested at 24, 48 and 72 h. SOD1, SOD2, catalase and thioredoxin 1 mRNA levels were quantified by real-time RT-PCR and normalized with GAPDH and RPS18 using the delta delta Ct method. Mean results from three independent experiments are shown. aP≤ 0.05 comparison of SOD1 expression in cells treated with SAM vs untreated cells; cP≤ 0.05, SOD2 expression of SAM treated cells vs untreated; and eP≤ 0.05, TRX1 expression of SAM treated cells vs untreated; B: Total glutathione amount in HCV-replicon cells treated with SAM. Huh7 HCV-replicon cells (2 × 10⁵ cells) were treated with 1 mmol/L SAM. Total glutathione level was evaluated at different times by Ellman’s recycling method (0-24 h). Mean results from three independent experiments are shown; C: Effect of SAM in ROS levels. HCV replicon-containing cells (2 × 10⁴ cells) were incubated with 1 mmol/L SAM at different time points (0.5, 1, 3, 12, 24 and 48 h). ROS levels were assessed by DCFH-DA assay. Fluorescence was measured at 503 nm and 530 nm, excitation and emission wavelengths, respectively. Hydrogen peroxide (1 μmol/L H2O2) was used as a positive damage control and pyrrolidine dithiocarbamate (5 μmol/L PDTC) as antioxidant control. SAM: S-adenosyl-L-methionine; HCV: Hepatitis C virus; SOD: Superoxide dismutase; ROS: Reactive oxidative species; PDTC: Pyrrolidin dithiocarbamate.
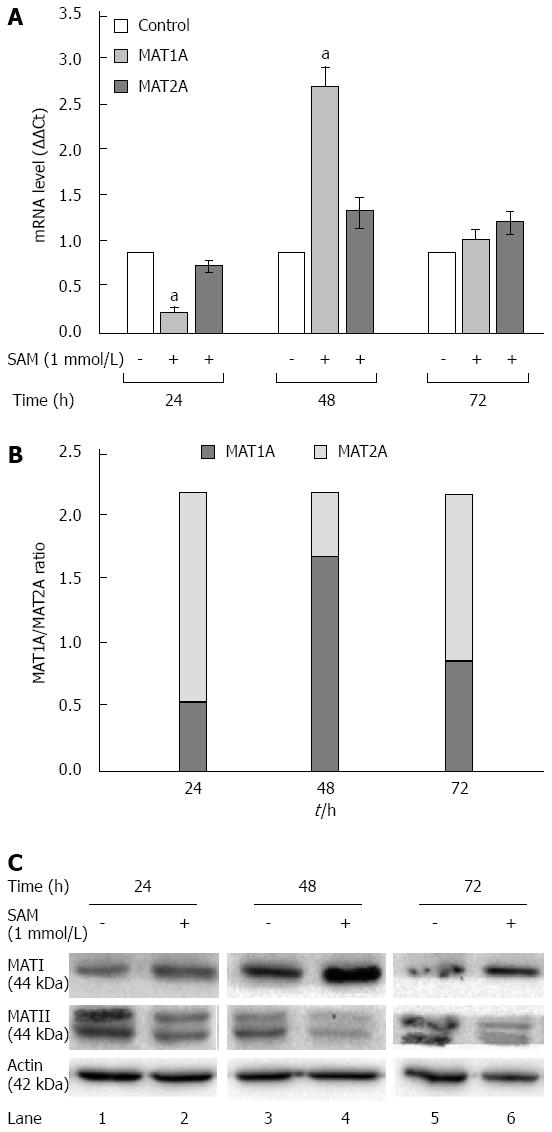
Figure 5 Effect of S-adenosyl-L-methionine on methionine adenosyltransferase 1/2 turnover.
A: Assesment of MAT-mRNA: Huh7 HCV replicon cells (2 × 10⁵ cells) were incubated with 1 mmol/L SAM and then cells were harvested at 24, 48 and 72 h and MAT1 and MAT2 mRNA levels were quantified by real-time RT-PCR and normalized with GAPDH and RPS18 using delta delta Ct method. Mean results from three independent experiments are shown. aP≤ 0.05 comparison of SAM vs untreated cells; B: MAT1A/MAT2A Turnover: Measured MAT1A/MAT2A expression represented as a total; C: MAT1 and MAT2 protein expression: Huh7 HCV replicon cells (2 × 10⁵ cells) were incubated with SAM 1 mmol/L. Cells were harvested at 24, 48 and 72 h and total proteins were obtained. Cell lysates were prepared, and equal amounts of protein extracts (40 μg) were subjected to immunoblot analysis to detect MAT1, MAT2 and actin levels. SAM: S-adenosyl-L-methionine; HCV: Hepatitis C virus; MAT: Methionine adenosyltransferase.
- Citation: Lozano-Sepulveda SA, Bautista-Osorio E, Merino-Mascorro JA, Varela-Rey M, Muñoz-Espinosa LE, Cordero-Perez P, Martinez-Chantar ML, Rivas-Estilla AM. S-adenosyl-L-methionine modifies antioxidant-enzymes, glutathione-biosynthesis and methionine adenosyltransferases-1/2 in hepatitis C virus-expressing cells. World J Gastroenterol 2016; 22(14): 3746-3757
- URL: https://www.wjgnet.com/1007-9327/full/v22/i14/3746.htm
- DOI: https://dx.doi.org/10.3748/wjg.v22.i14.3746


