Copyright
©The Author(s) 2016.
World J Gastroenterol. Apr 7, 2016; 22(13): 3564-3572
Published online Apr 7, 2016. doi: 10.3748/wjg.v22.i13.3564
Published online Apr 7, 2016. doi: 10.3748/wjg.v22.i13.3564
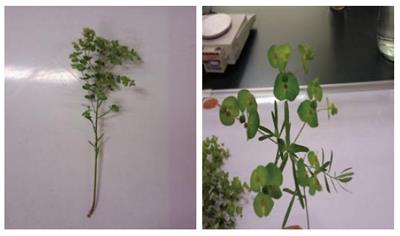
Figure 1 Euphorbia esula Linn collected in Yan'an, China in June.
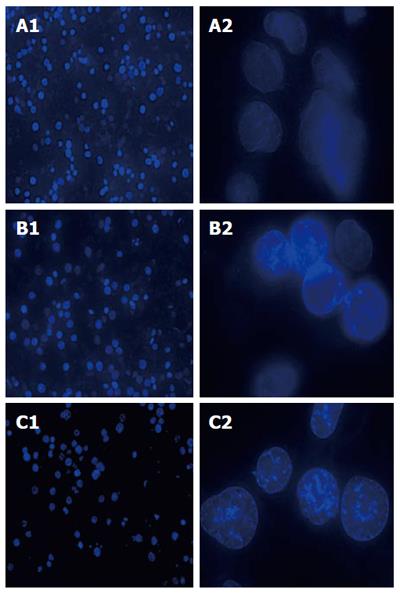
Figure 2 Nuclear morphological changes observed using a fluorescence microscopy in SGC-7901 cells treated with Euphorbia esula extract at different concentrations and for 24 h, stained by Hoechst 33258.
A1: Untreated, magnification × 200; A2: Untreated, magnification × 1000; B1: 40 mg/L, magnification × 200; B2: 40 mg/L, magnification × 1000; C1: 80 mg/L, magnification × 200; C2: 80 mg/L, magnification × 1000.
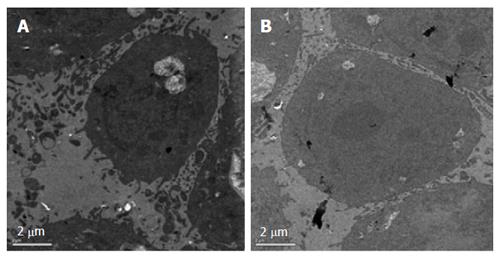
Figure 3 Morphology of SGC-7901 cells observed using a transmission electron microscope.
A: After treatment with 40 mg/L Euphorbia esula extract for 24 h; B: Untreated cells. Bar = 2 μm.
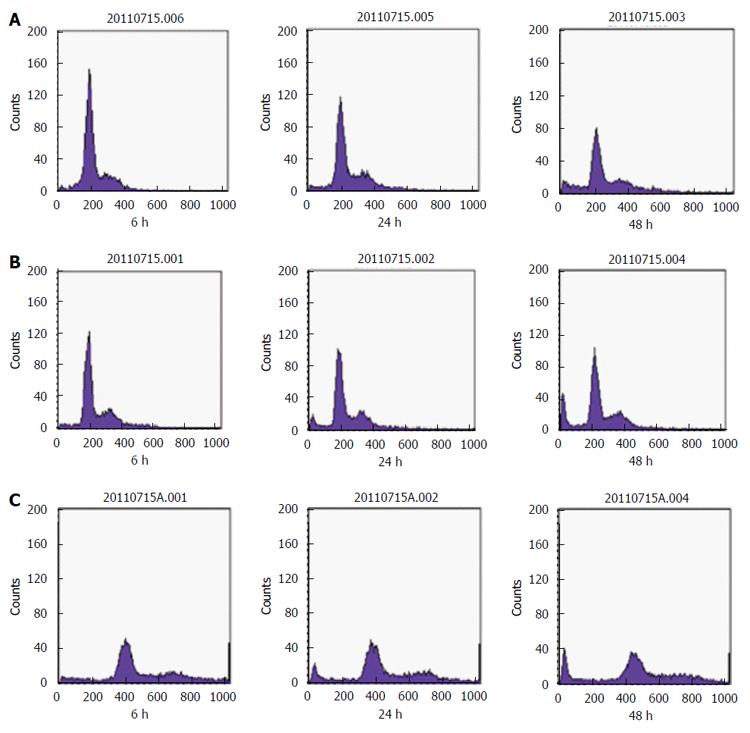
Figure 4 Flow cytometry detection of the apoptotic peak.
SGC-7901 cells were treated with different concentrations of Euphorbia esula (E. esula) extract and flow cytometry was performed at three time points. A: Untreated SGC-7901 cells used as a control; B: Treated with 40 mg/L E. esula extract; C: Treated with 80 mg/L E. esula extract.
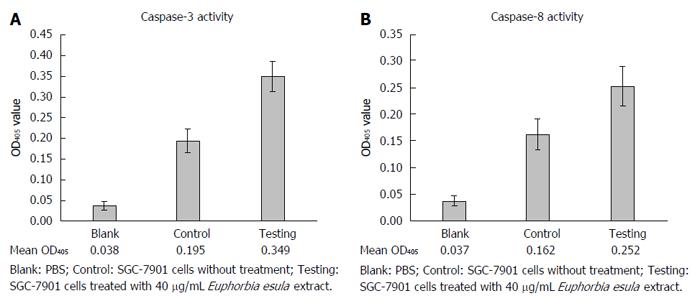
Figure 5 Activation of caspase-3 and caspase-8 in SGC-7901 cells after treatment with Euphorbia esula extract, measured using spectrophotometry.
Concentration of Euphorbia esula extract: 40 mg/L; duration of treatment: 24 h; n = 3.
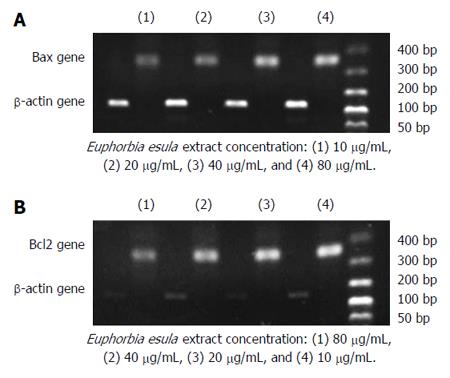
Figure 6 Agarose gel electrophoresis of RT-PCR products showing dose-dependent alterations of Bax and Bcl2 gene expression in SGC-7901 cells treated with Euphorbia esula extract.
A: Bax mRNA level increased with the concentration of Euphorbia esula (E. esula) extract; B: Bcl2 mRNA level increased with decreased concentration of E. esula extract.
- Citation: Fu ZY, Han XD, Wang AH, Liu XB. Apoptosis of human gastric carcinoma cells induced by Euphorbia esula latex. World J Gastroenterol 2016; 22(13): 3564-3572
- URL: https://www.wjgnet.com/1007-9327/full/v22/i13/3564.htm
- DOI: https://dx.doi.org/10.3748/wjg.v22.i13.3564


