Copyright
©The Author(s) 2016.
World J Gastroenterol. Mar 14, 2016; 22(10): 3015-3022
Published online Mar 14, 2016. doi: 10.3748/wjg.v22.i10.3015
Published online Mar 14, 2016. doi: 10.3748/wjg.v22.i10.3015
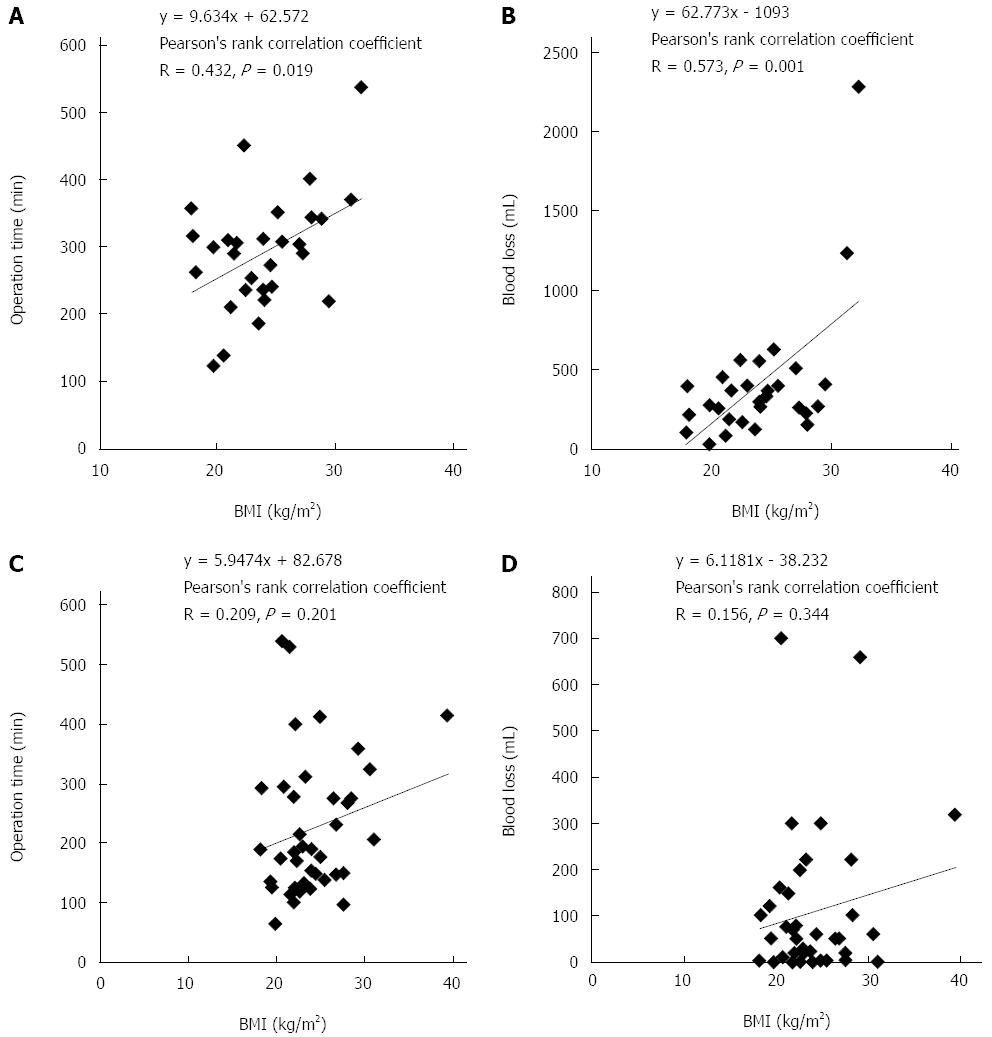
Figure 1 Scatter plot.
A: Scatter plot showed the relationship between BMI and operation time in open liver resection; B: Scatter plot showed the relationship between BMI and blood loss in open liver resection; C: Scatter plot showed the relationship between BMI and operation time in laparoscopic liver resection; D: Scatter plot showed the relationship between BMI and blood loss in laparoscopic liver resection. BMI: Body mass index.
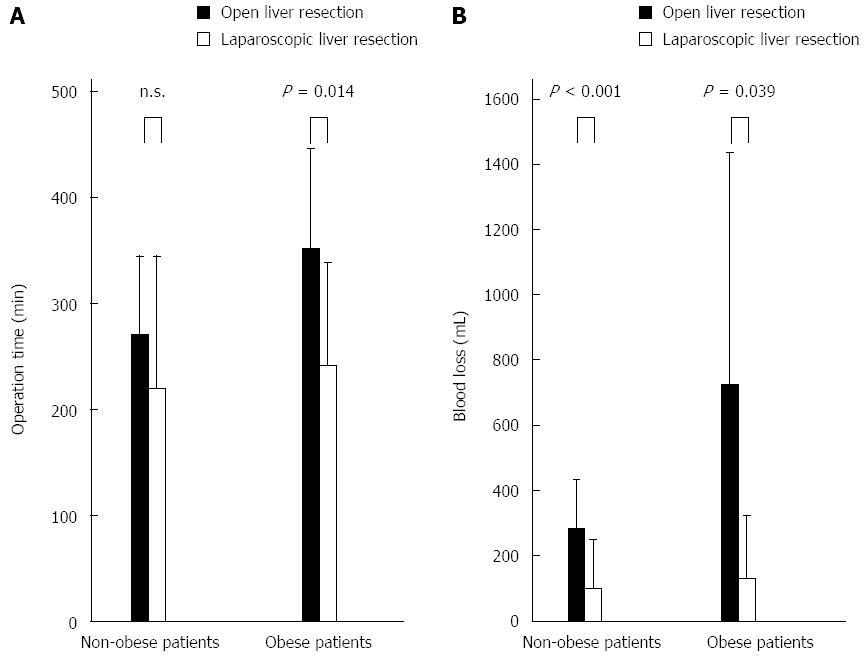
Figure 2 Surgical approach in obese and non-obese patients.
A: Comparison of operation time according to the surgical approach in obese and non-obese patients; B: Comparison of blood loss according to the surgical approach in obese and non-obese patients.
- Citation: Uchida H, Iwashita Y, Saga K, Takayama H, Watanabe K, Endo Y, Yada K, Ohta M, Inomata M. Benefit of laparoscopic liver resection in high body mass index patients. World J Gastroenterol 2016; 22(10): 3015-3022
- URL: https://www.wjgnet.com/1007-9327/full/v22/i10/3015.htm
- DOI: https://dx.doi.org/10.3748/wjg.v22.i10.3015


