Copyright
©The Author(s) 2016.
World J Gastroenterol. Mar 14, 2016; 22(10): 2971-2980
Published online Mar 14, 2016. doi: 10.3748/wjg.v22.i10.2971
Published online Mar 14, 2016. doi: 10.3748/wjg.v22.i10.2971
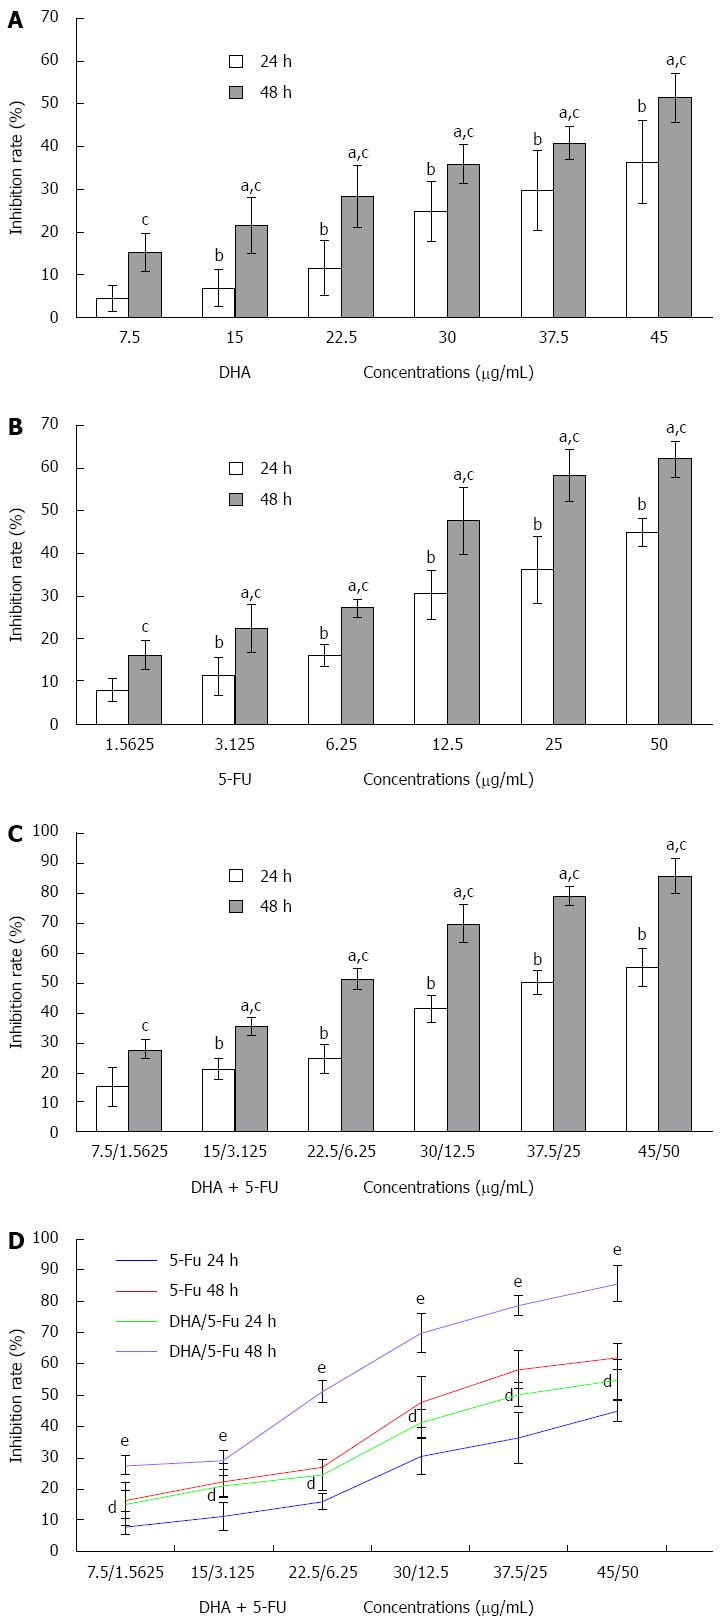
Figure 1 Inhibitory effect of docosahexaenoic acid or/and 5-fluorouracil on the growth of AGS cells.
A-C: Growth inhibition rate of AGS following 24 or 48 h treatment with increasing concentrations of docosahexaenoic acid (DHA) and 5-fluorouracil (5-FU) alone or in combination. The inhibition was in a significant time and dose-dependent manner; D: DHA notably increased 5-FU cytotoxicity. aP < 0.05 vs cells treated with DHA (7.50 μg/mL), 5-FU (1.5625 μg/mL), and DHA (7.5 μg/mL) plus 5-FU (1.5625 μg/mL) for 48 h, respectively; bP < 0.05 vs cells treated with DHA (7.50 μg/mL), 5-FU (1.5625 μg/mL), and DHA (7.50 μg/mL) plus 5-FU (1.5625 μg/mL) for 24 h, respectively; cP < 0.05 vs cells treated with various concentrations of DHA, 5-FU and DHA plus 5-FU for 24 h, respectively; dP < 0.05 vs cells treated with a series of concentrations of 5-FU alone for 24 h; eP < 0.05 vs cells treated with a series of concentrations of 5-FU alone for 48 h.
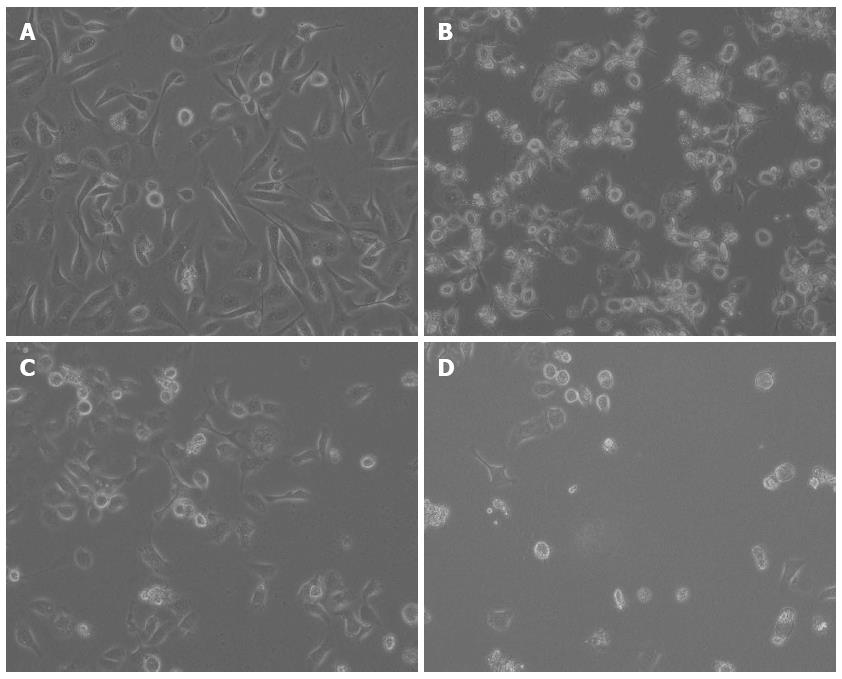
Figure 2 Morphological changes in AGS cells treated with docosahexaenoic acid and 5-fluorouracil alone or in combination.
AGS cells were treated with medium only (control, A), docosahexaenoic acid (DHA) alone (30.00 μg/mL, B), 5-fluorouracil (5-FU) alone (12.50 μg/mL, C), or DHA plus 5-FU (30.00 μg/mL + 12.50 μg/mL, D) for 48 h. The cells were observed under an inverted-phase microscope. The photographs were taken at magnification × 200.
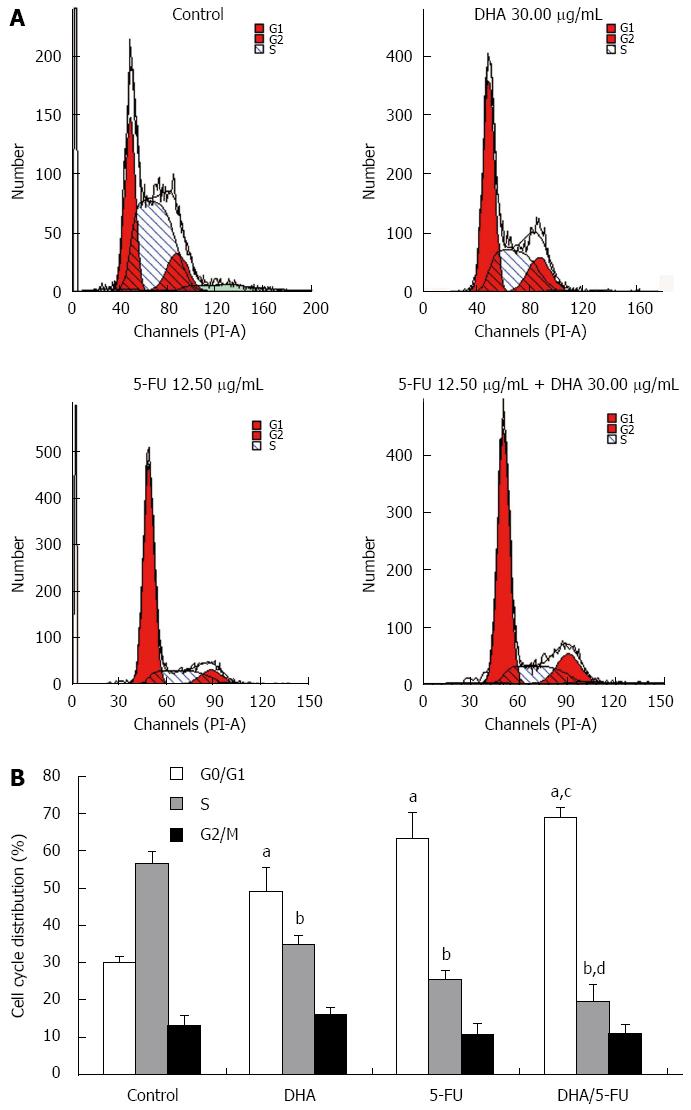
Figure 3 Cell cycle analysis of AGS cell after docosahexaenoic acid or 5-fluorouracil treatment or DHA/5-FU co-administration.
Docosahexaenoic acid (DHA) enhanced 5-fluorouracil (5-FU)-induced cell cycle arrest at G0/G1 phase in AGS cells. AGS cells were exposed to medium only (control), DHA alone (30.00 μg/mL), 5-FU alone (12.5 μg/mL), or DHA (30.00 μg/mL) plus 5-FU (12.50 μg/mL) for 48 h. A: A representative set of results showing cell cycle distribution in different groups; B: An accumulation of cells in the G0/G1 phase and a decrease of cells in the S phase after treatment with DHA or 5-FU, and a significant potentiation in accumulation of cells in G0/G1 phase and reduction in S phase after the combined treatment of 5-FU with DHA. Data shown are a representative example of three separate experiments with similar results. aP < 0.05 vs control cells in the G0/G1 phase; bP < 0.05 vs control cells in the S phase; cP < 0.05 vs cells treated with DHA or 5-FU in the G0/G1 phase; dP < 0.05 vs cells treated with DHA or 5-FU in the S phase.
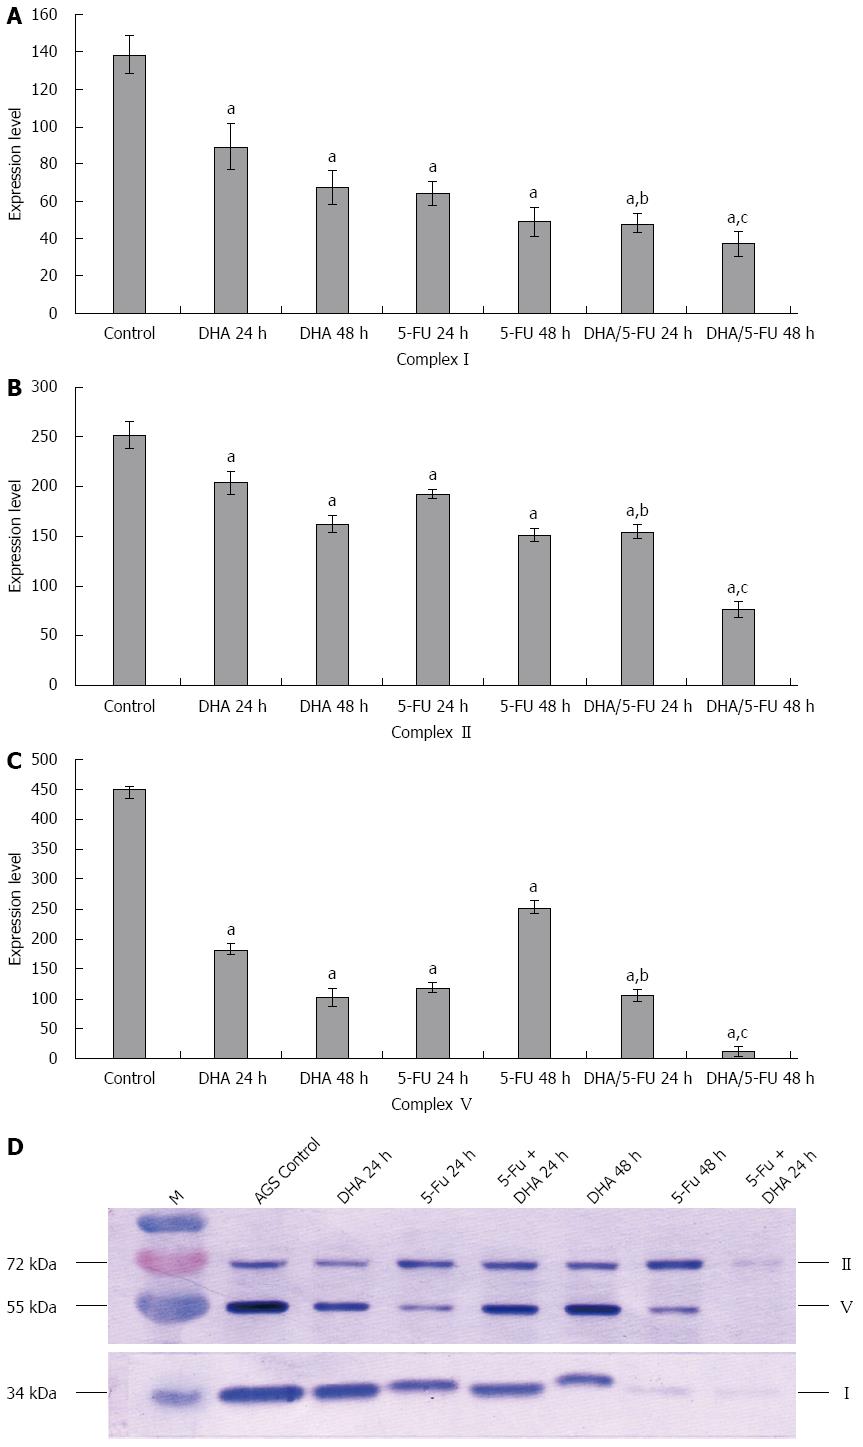
Figure 4 Effect of docosahexaenoic acid and 5-fluorouracil alone and in combination on the expression of mitochondrial electron transfer chain complexes in AGS cells.
AGS cells were exposed to medium only (control), docosahexaenoic acid (DHA) alone (30.00 μg/mL), 5-fluorouracil (5-FU) alone (12.50 μg/mL), or DHA (30.00 μg/mL) plus 5-FU (12.50 μg/mL) for 24 and 48 h. The cells were harvested and subjected to Western blot analysis to detect expression of mitochondrial electron transfer chain complexes I, II and V using specific antibodies for each protein. A-D: Incubation of the cells with DHA or 5-FU for 24 and 48 h resulted in a significant decrease in the expression of complexes I, II and V as compared with control cells; the combination of DHA with 5-FU exhibited a significant decrease in the expression of complexes I, II and V in contrast to DHA and 5-FU group. The results presented are the mean ± SEM of at least three independent experiments. aP < 0.05 vs control cells; bP < 0.05 vs cells treated with DHA and 5-FU alone for 24 h, respectively; cP < 0.05 vs cells treated with DHA and 5-FU alone for 48 h, respectively.
- Citation: Gao K, Liang Q, Zhao ZH, Li YF, Wang SF. Synergistic anticancer properties of docosahexaenoic acid and 5-fluorouracil through interference with energy metabolism and cell cycle arrest in human gastric cancer cell line AGS cells. World J Gastroenterol 2016; 22(10): 2971-2980
- URL: https://www.wjgnet.com/1007-9327/full/v22/i10/2971.htm
- DOI: https://dx.doi.org/10.3748/wjg.v22.i10.2971


