Copyright
©The Author(s) 2016.
World J Gastroenterol. Mar 14, 2016; 22(10): 2960-2970
Published online Mar 14, 2016. doi: 10.3748/wjg.v22.i10.2960
Published online Mar 14, 2016. doi: 10.3748/wjg.v22.i10.2960
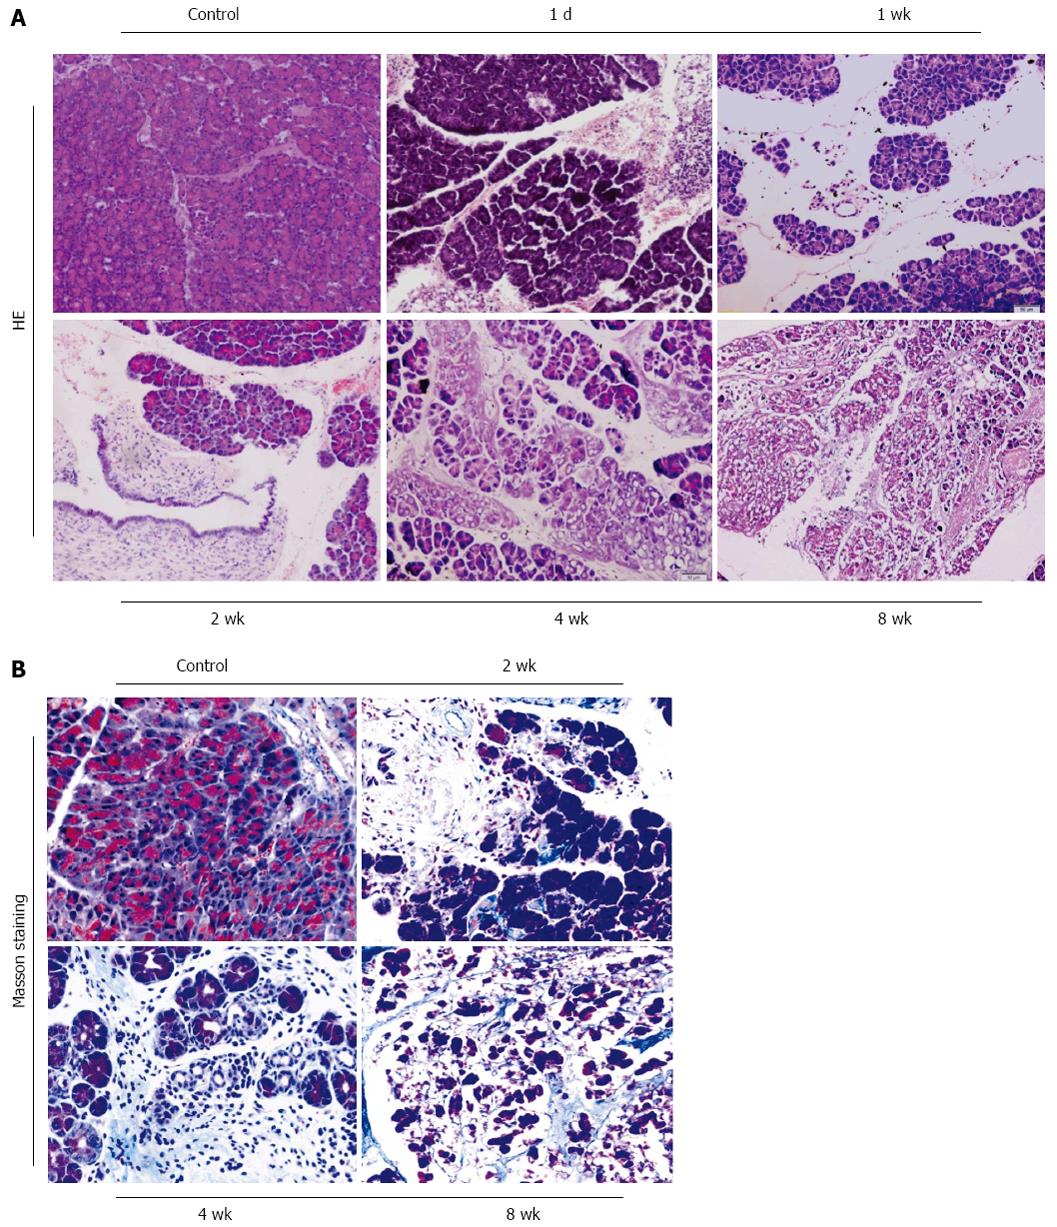
Figure 1 Morphological changes in pancreatic sections obtained from mice with chronic pancreatitis induced by Dibutyltin Dichloride joint Ethanol drinking.
A: The pancreatic morphology at different time-point by HE staining (original magnification: 100 ×); B: Collagen deposition by Masson staining (original magnification: 200 ×).
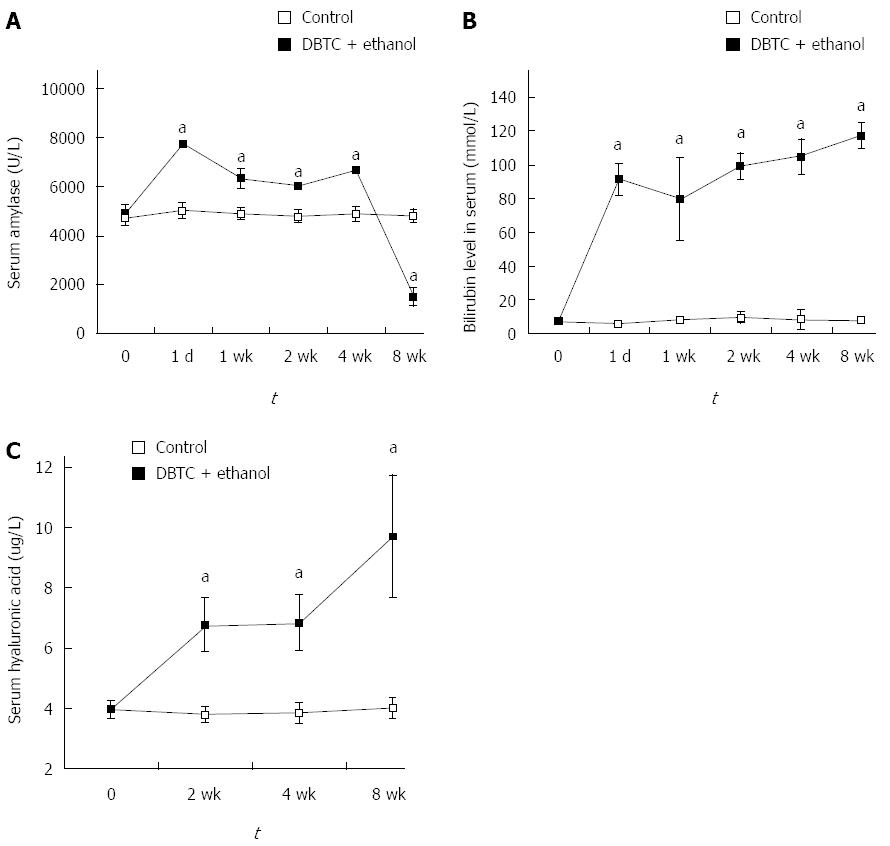
Figure 2 Biochemical parameter changes in serum of mice with chronic pancreatitis induced DBTC-induced by Dibutyltin Dichloride joint Ethanol drinking at the indicated time.
A: Amylase activity (U/L); B: Level of bilirubin (mmol/L); C: Concentration of hyaluronic acid (μg/L). Values are shown as mean ± SD (n = 8). Results are expressed as mean ± SD compared with control; aP < 0.05 vs control.
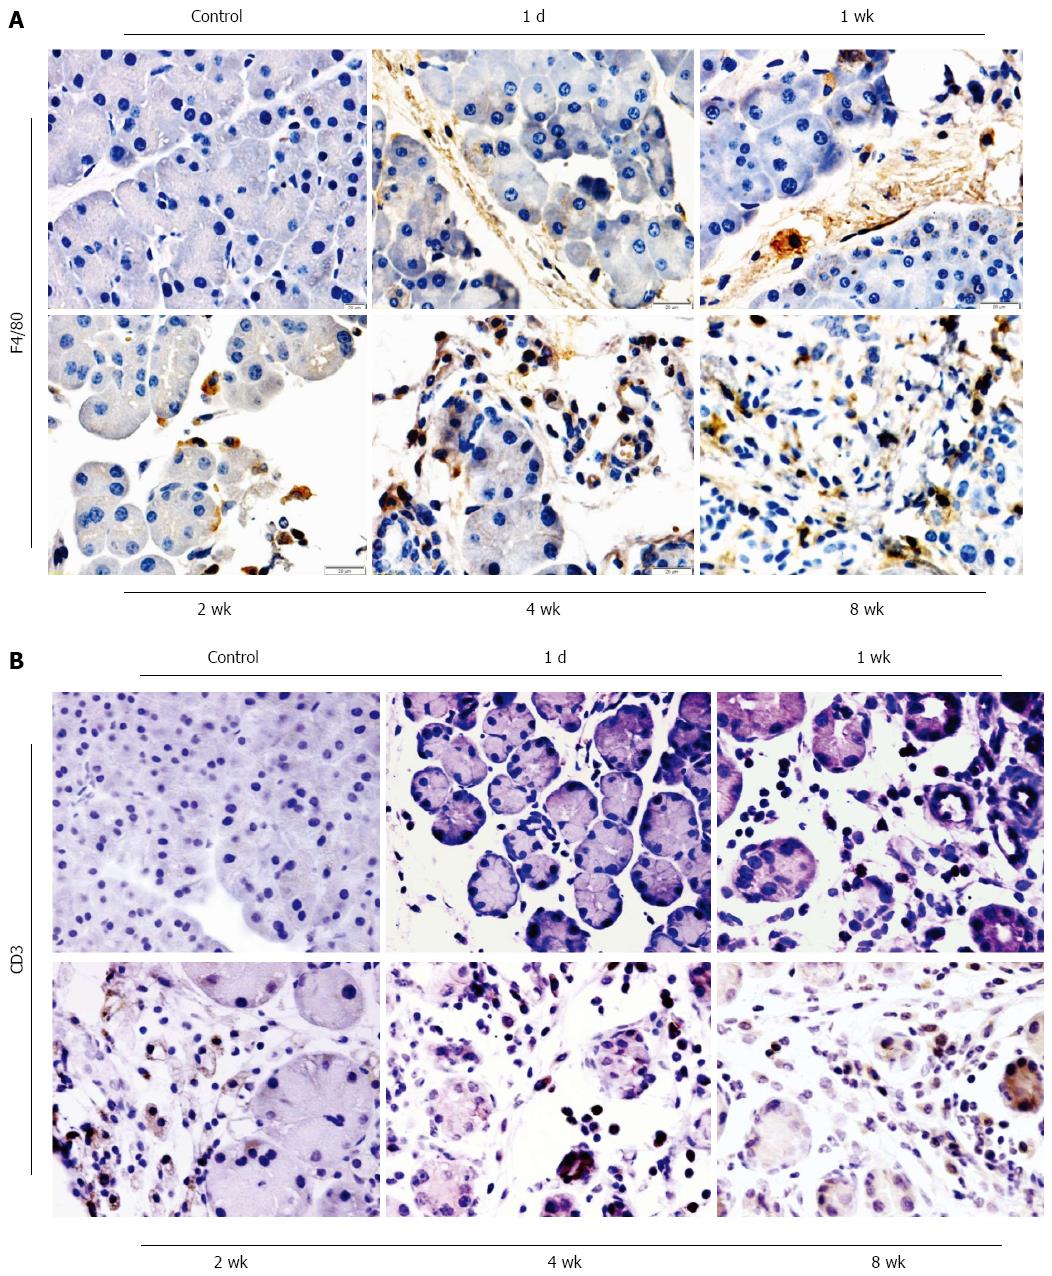
Figure 3 Immunohistochemistry of macrophages and T lymphocytes in DBTC-induced pancreatitis at different time-point.
A: Macrophages were stained using an anti-mice macrophage antibody (F4/80) (original magnification: 400 ×); B: T lymphocytes were stained using an anti-mice CD3 monoclonal antibody (original magnification: 400 ×).
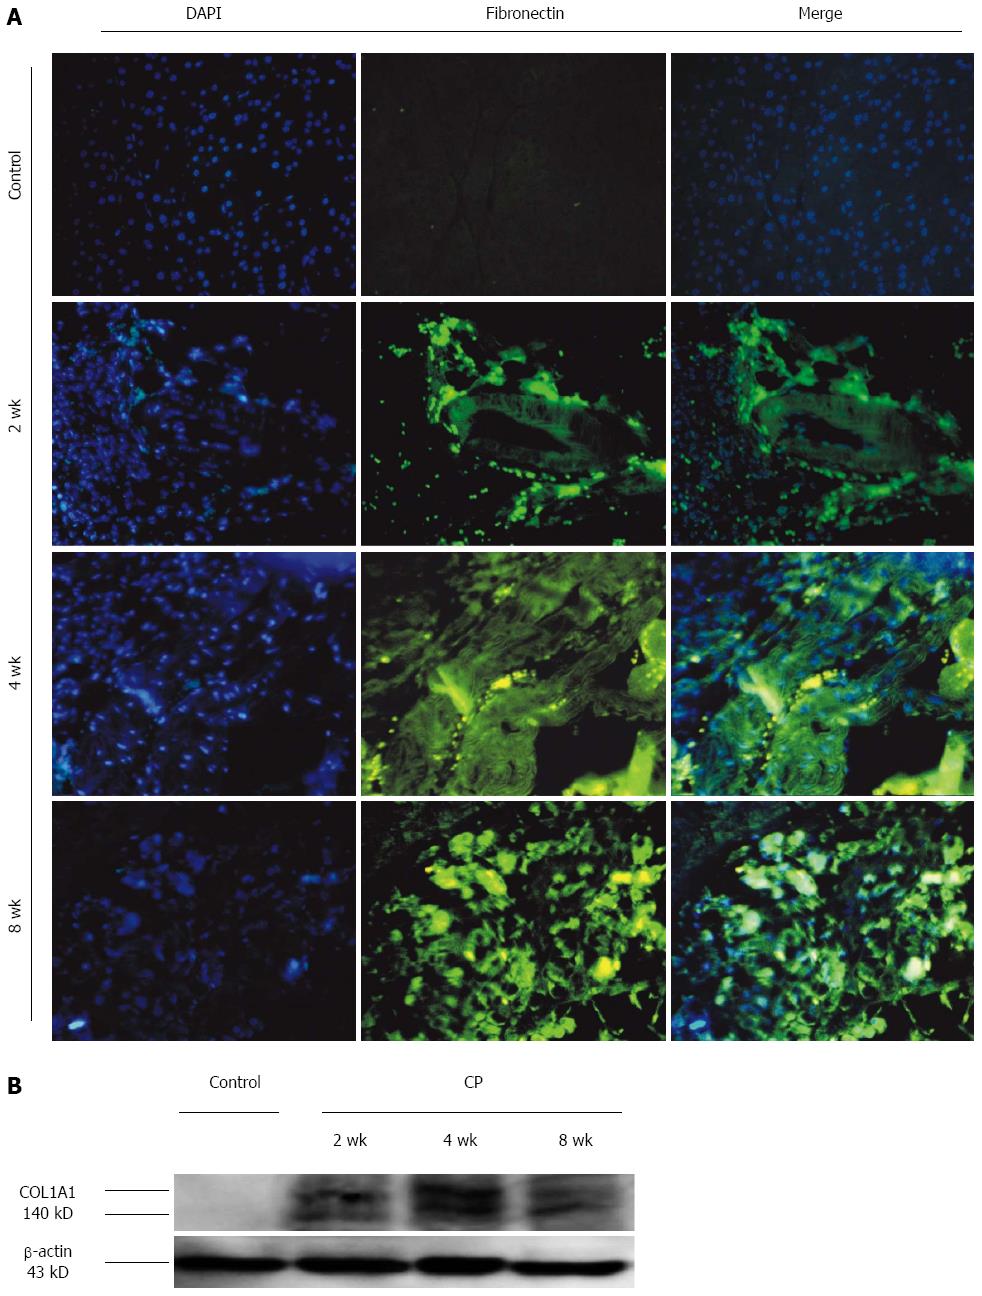
Figure 4 Fibrotic parameter changes in pancreas of mice with chronic pancreatitis induced DBTC-induced by dibutyltin dichloride joint ethanol drinking at the indicated time.
A: FN expression in pancreas with immunofluorescence double staining of FN and DAPI showing co-expression in the pancreas (original magnification: 200 ×); B: COL1A1 expression in pancreas with western blot.
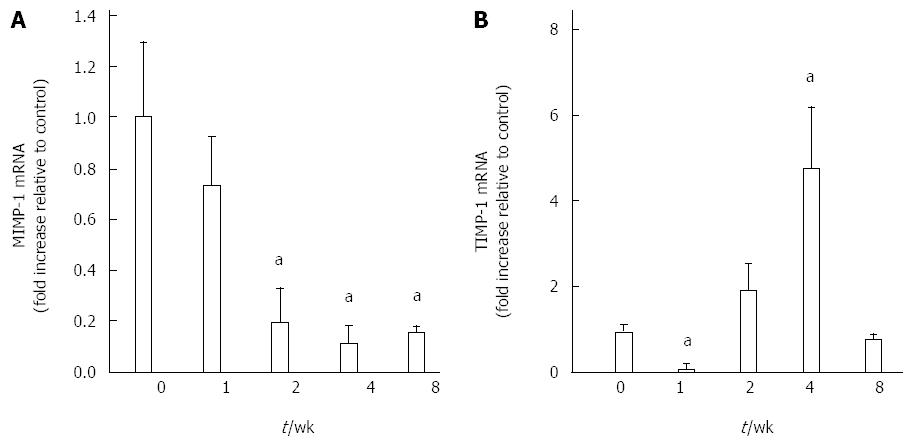
Figure 5 MMP-1mRNA and TIMP-1mRNA changes in pancreas of mice with chronic pancreatitis induced DBTC-induced by dibutyltin dichloride joint ethanol drinking at the indicated time.
A: MMP-1 mRNA expression in pancreas with Q-PCR; B: TIMP-1 mRNA expression in pancreas with Q-PCR. Values are shown as mean ± SD (n = 8). Results are expressed as mean ± SD. aP < 0.05 vs control.
- Citation: Zhang H, Liu B, Xu XF, Jiang TT, Zhang XQ, Shi YL, Chen Y, Liu F, Gu J, Zhu LJ, Wu N. Pathophysiology of chronic pancreatitis induced by dibutyltin dichloride joint ethanol in mice. World J Gastroenterol 2016; 22(10): 2960-2970
- URL: https://www.wjgnet.com/1007-9327/full/v22/i10/2960.htm
- DOI: https://dx.doi.org/10.3748/wjg.v22.i10.2960


