Copyright
©The Author(s) 2015.
World J Gastroenterol. Mar 7, 2015; 21(9): 2836-2839
Published online Mar 7, 2015. doi: 10.3748/wjg.v21.i9.2836
Published online Mar 7, 2015. doi: 10.3748/wjg.v21.i9.2836
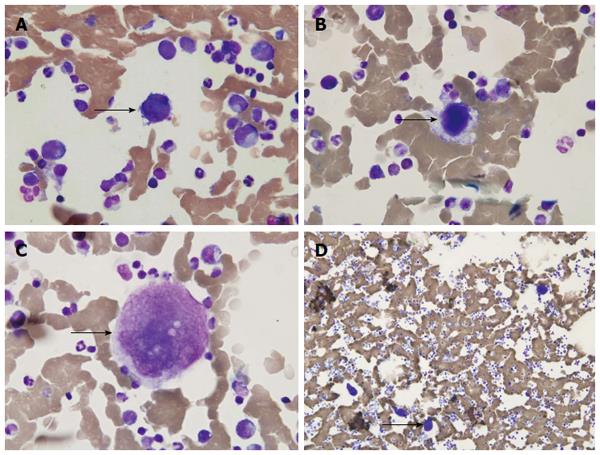
Figure 1 Bone marrow aspiration slides.
The bone marrow aspiration slides showed no bone marrow hypoplasia or aplasia, but at higher magnifications, there were megakaryocytes (A), promegakaryoblasts (B) and granular megakaryocytes (C). In addition, there were many granular megakaryocytes at higher magnifications (D).
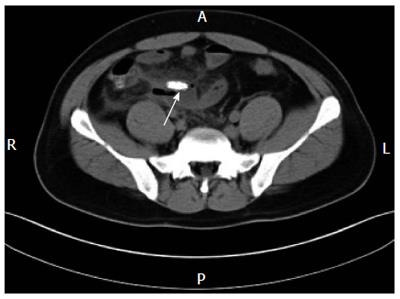
Figure 2 Computed tomography scan of the abdomen.
Computed tomography scan of the abdomen showed that the fecalith was around the ileocecal junction in the right lower quadrant.
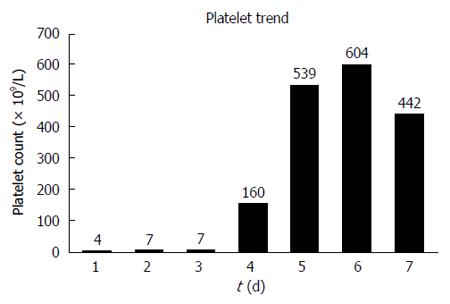
Figure 3 Platelet count and platelet trend curve.
The platelet count was 7 × 10⁹/L on the first day, 7 × 10⁹/L on the second day, and 160 × 109/L on the fourth day.
- Citation: Zhang HH, Gu GL, Zhang XY, Fan Q, Wang XY, Wei XM. Non-surgical contraindication for acute appendicitis with secondary thrombocytopenia: A case report. World J Gastroenterol 2015; 21(9): 2836-2839
- URL: https://www.wjgnet.com/1007-9327/full/v21/i9/2836.htm
- DOI: https://dx.doi.org/10.3748/wjg.v21.i9.2836


