Copyright
©The Author(s) 2015.
World J Gastroenterol. Mar 7, 2015; 21(9): 2807-2815
Published online Mar 7, 2015. doi: 10.3748/wjg.v21.i9.2807
Published online Mar 7, 2015. doi: 10.3748/wjg.v21.i9.2807
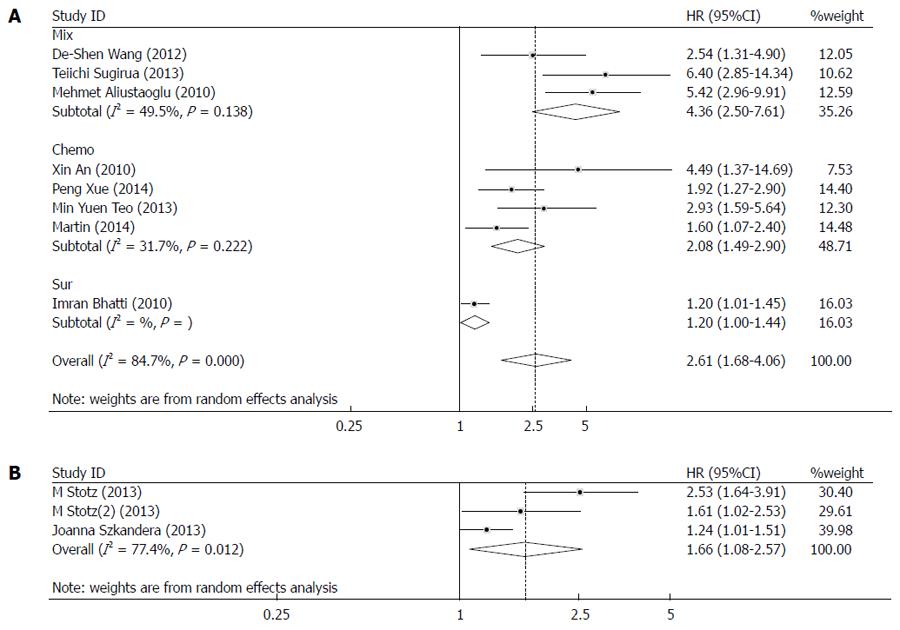
Figure 1 Forest plots.
A: Meta-analysis of the association between high neutrophil to lymphocyte ratio (NLR) and overall survival; B: Meta-analysis of the association between high NLR and cancer specific survival. Results are presented as individual and combined hazard ratios (HR) and 95%CI. Chemo: Chemotherapy; Sur: Surgical resection; Mix: Mixed treatment.
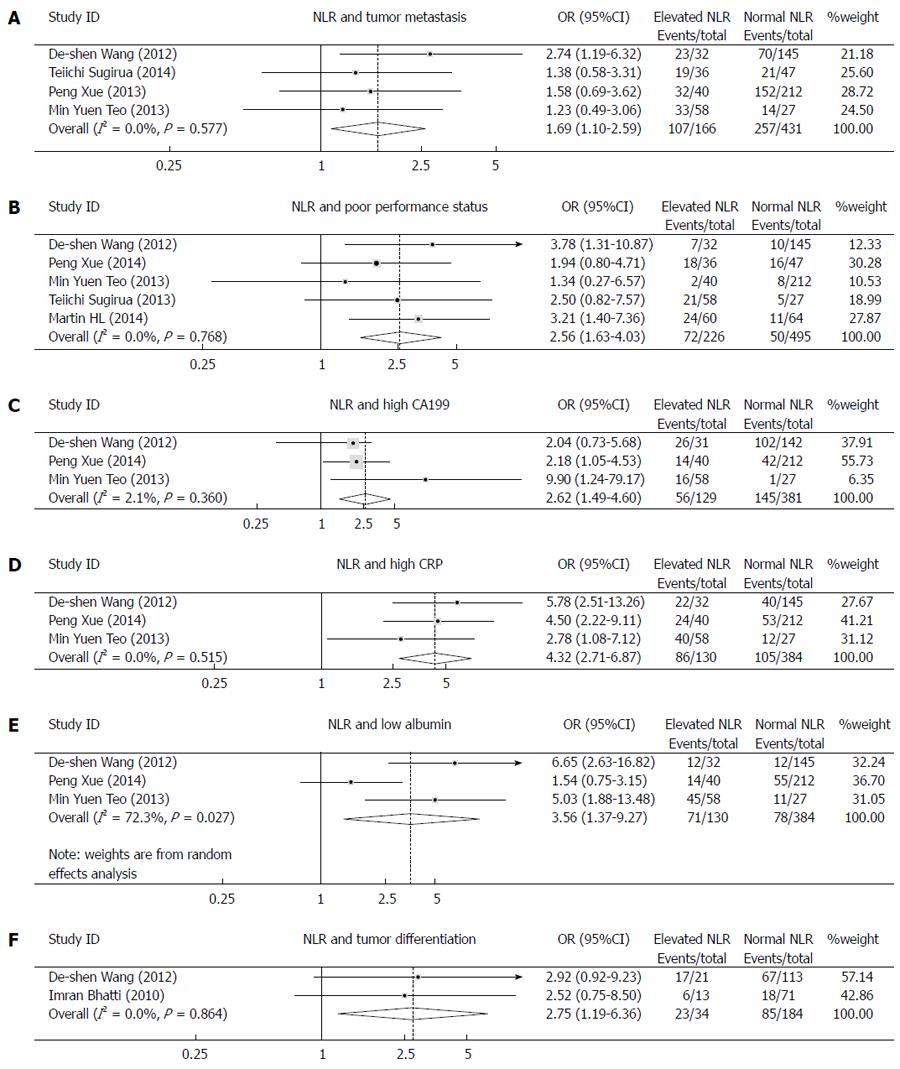
Figure 2 Forest plots.
A: Meta-analysis of the association between high neutrophil to lymphocyte ratio (NLR) and tumor metastasis; B: Meta-analysis of the association between high NLR and poor performance status; C: Meta-analysis of the association between high NLR and high carbohydrate antigen 199 (CA199); D: Meta-analysis of the association between high NLR and high C-reactive protein (CRP); E: Meta-analysis of the association between high NLR and low albumin; F: Meta-analysis of the association between high NLR and tumor differentiation. Results are presented as individual and combined odds ratio (OR) and 95%CI.
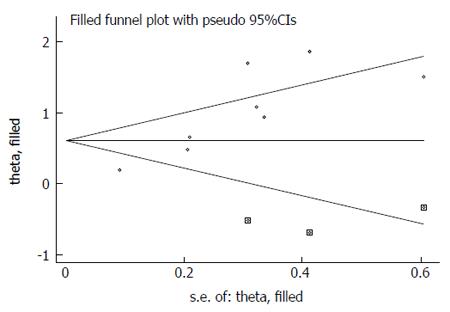
Figure 3 Funnel plot adjusted using a trim and fill method for overall survival.
Diamonds: Included studies; diamonds in squares: Presumed missing studies.
- Citation: Yang JJ, Hu ZG, Shi WX, Deng T, He SQ, Yuan SG. Prognostic significance of neutrophil to lymphocyte ratio in pancreatic cancer: A meta-analysis. World J Gastroenterol 2015; 21(9): 2807-2815
- URL: https://www.wjgnet.com/1007-9327/full/v21/i9/2807.htm
- DOI: https://dx.doi.org/10.3748/wjg.v21.i9.2807


