Copyright
©The Author(s) 2015.
World J Gastroenterol. Feb 28, 2015; 21(8): 2534-2541
Published online Feb 28, 2015. doi: 10.3748/wjg.v21.i8.2534
Published online Feb 28, 2015. doi: 10.3748/wjg.v21.i8.2534
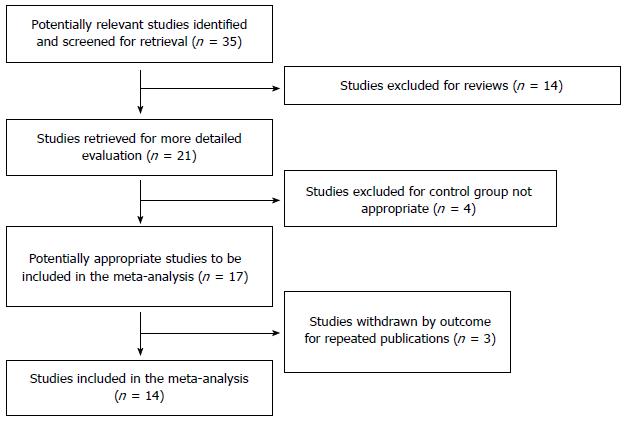
Figure 1 A flow diagram of articles retrieved and inclusion progress through the stage of meta-analysis.
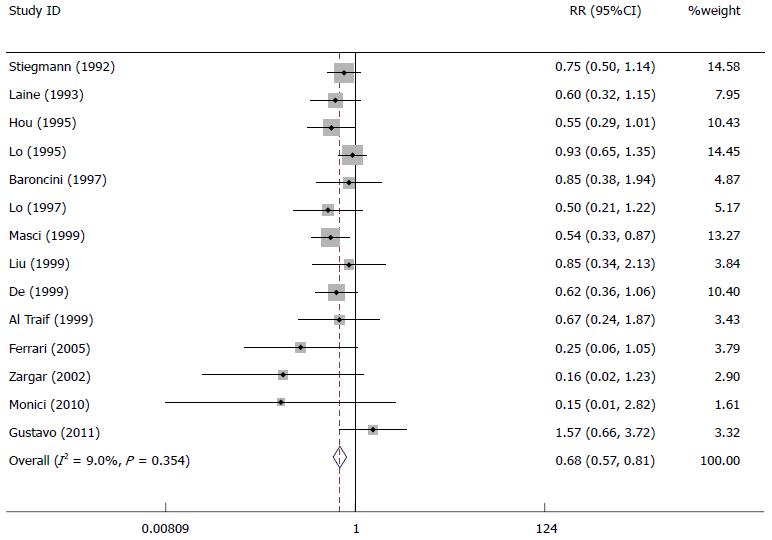
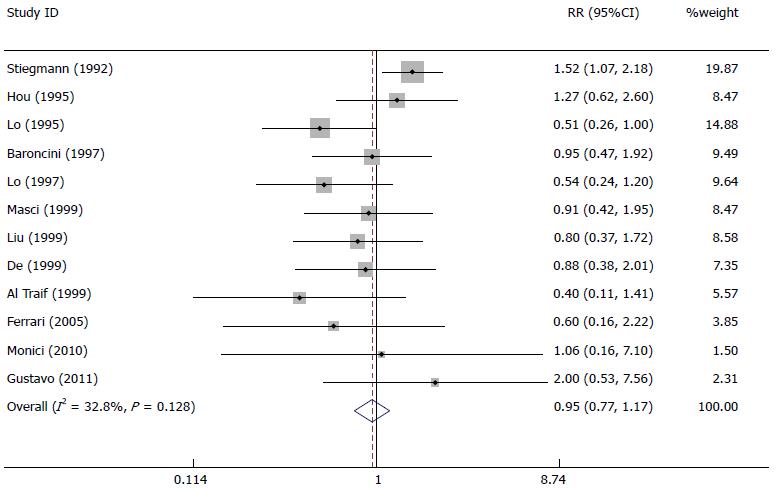
Figure 2 Forest plot of the rebleeding rate in the treatment of esophageal variceal bleeding by endoscopic variceal ligation vs endoscopic injection sclerotherapy.
EVL: Endoscopic variceal ligation; EIS: Endoscopic injection sclerotherapy.
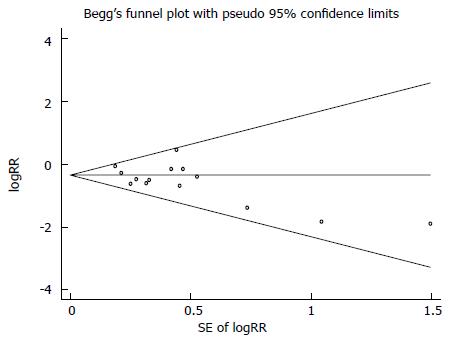
Figure 3 Begg’s Funnel plot analysis of each study.
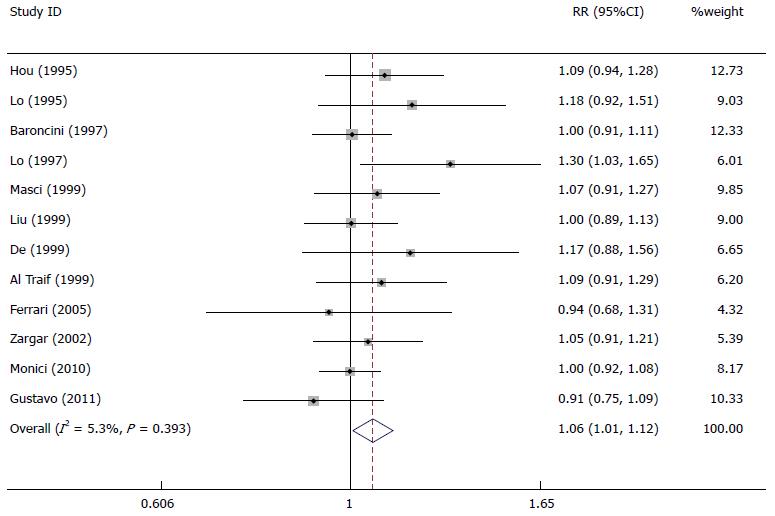
Figure 4 Forest plot of the variceal eradication rate in the treatment of esophageal variceal bleeding by endoscopic variceal ligation vs endoscopic injection sclerotherapy.
EVL: Endoscopic variceal ligation; EIS: Endoscopic injection sclerotherapy.
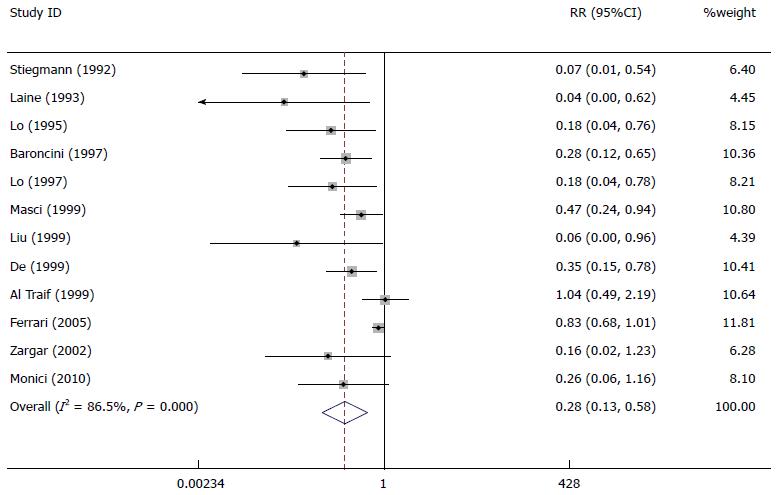
Figure 5 Forest plot of the mortality rate in the treatment of esophageal variceal bleeding by endoscopic variceal ligation vs endoscopic injection sclerotherapy.
EVL: Endoscopic variceal ligation; EIS: Endoscopic injection sclerotherapy.
Figure 6 Forest plot of the complication rate in the treatment of esophageal variceal bleeding by endoscopic variceal ligation vs endoscopic injection sclerotherapy.
EVL: Endoscopic variceal ligation; EIS: Endoscopic injection sclerotherapy.
- Citation: Dai C, Liu WX, Jiang M, Sun MJ. Endoscopic variceal ligation compared with endoscopic injection sclerotherapy for treatment of esophageal variceal hemorrhage: A meta-analysis. World J Gastroenterol 2015; 21(8): 2534-2541
- URL: https://www.wjgnet.com/1007-9327/full/v21/i8/2534.htm
- DOI: https://dx.doi.org/10.3748/wjg.v21.i8.2534


