Copyright
©The Author(s) 2015.
World J Gastroenterol. Feb 28, 2015; 21(8): 2336-2342
Published online Feb 28, 2015. doi: 10.3748/wjg.v21.i8.2336
Published online Feb 28, 2015. doi: 10.3748/wjg.v21.i8.2336
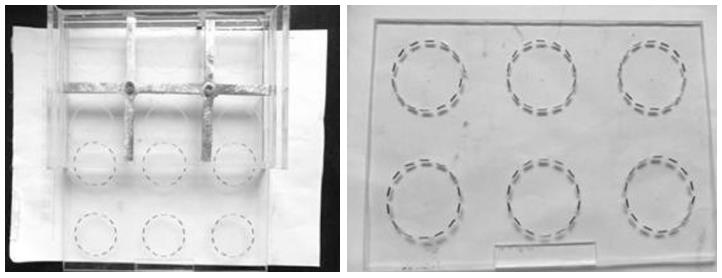
Figure 1 Appliance used for irradiation with 125I radioactive seeds.
Figure 2 Survival curves for PANC-1 and SW1990 cells after irradiation using 125I seeds.
The vertical ordinate represents the Napierian logarithm of survival fraction (SF) and the horizontal ordinate represents the radiation dose.
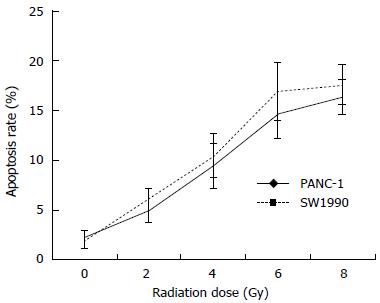
Figure 3 Apoptosis rates of PANC-1 and SW1990 cells after irradiation with 125I seeds at various doses.
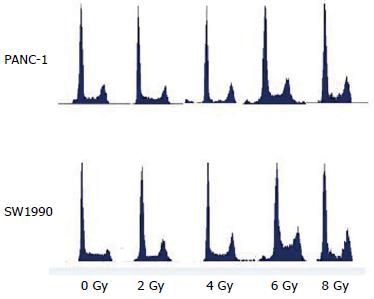
Figure 4 The cell cycle phases of PANC-1 and SW1990 cells after irradiation with 125I seeds at various doses.
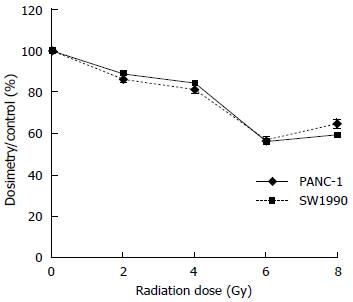
Figure 5 The DNA incorporation rates of PANC-1 and SW1990 cells after irradiation with 125I seeds at various doses.
-
Citation: Wang ZM, Lu J, Zhang LY, Lin XZ, Chen KM, Chen ZJ, Liu FJ, Yan FH, Teng GJ, Mao AW. Biological effects of low-dose-rate irradiation of pancreatic carcinoma cells
in vitro using 125I seeds. World J Gastroenterol 2015; 21(8): 2336-2342 - URL: https://www.wjgnet.com/1007-9327/full/v21/i8/2336.htm
- DOI: https://dx.doi.org/10.3748/wjg.v21.i8.2336


