Copyright
©The Author(s) 2015.
World J Gastroenterol. Feb 14, 2015; 21(6): 1851-1856
Published online Feb 14, 2015. doi: 10.3748/wjg.v21.i6.1851
Published online Feb 14, 2015. doi: 10.3748/wjg.v21.i6.1851
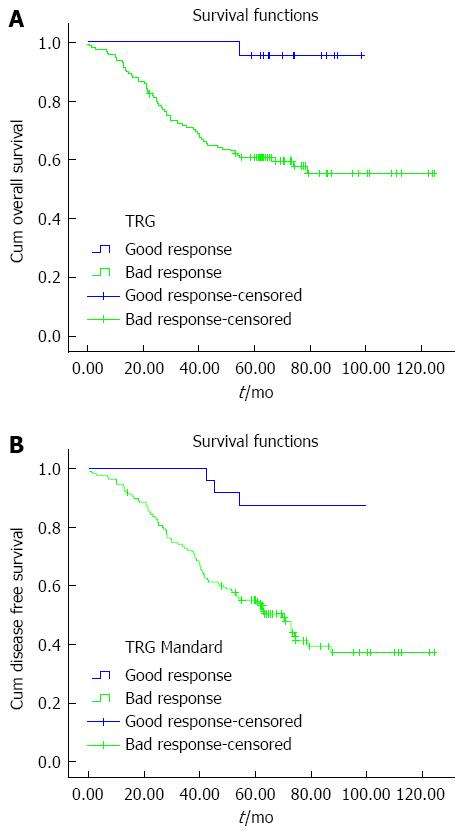
Figure 1 Kaplan-Meier survival curves were plotted to predict survival.
Five-year OS (A) and 5-year DFS (B) in the two Mandard groups. OS: Overall survival; DFS: Disease-free survival; TRG: Tumor regression grades.
- Citation: Peng YF, Yu WD, Pan HD, Wang L, Li M, Yao YF, Zhao J, Gu J. Tumor regression grades: Potential outcome predictor of locally advanced rectal adenocarcinoma after preoperative radiotherapy. World J Gastroenterol 2015; 21(6): 1851-1856
- URL: https://www.wjgnet.com/1007-9327/full/v21/i6/1851.htm
- DOI: https://dx.doi.org/10.3748/wjg.v21.i6.1851


