Copyright
©The Author(s) 2015.
World J Gastroenterol. Dec 28, 2015; 21(48): 13593-13598
Published online Dec 28, 2015. doi: 10.3748/wjg.v21.i48.13593
Published online Dec 28, 2015. doi: 10.3748/wjg.v21.i48.13593
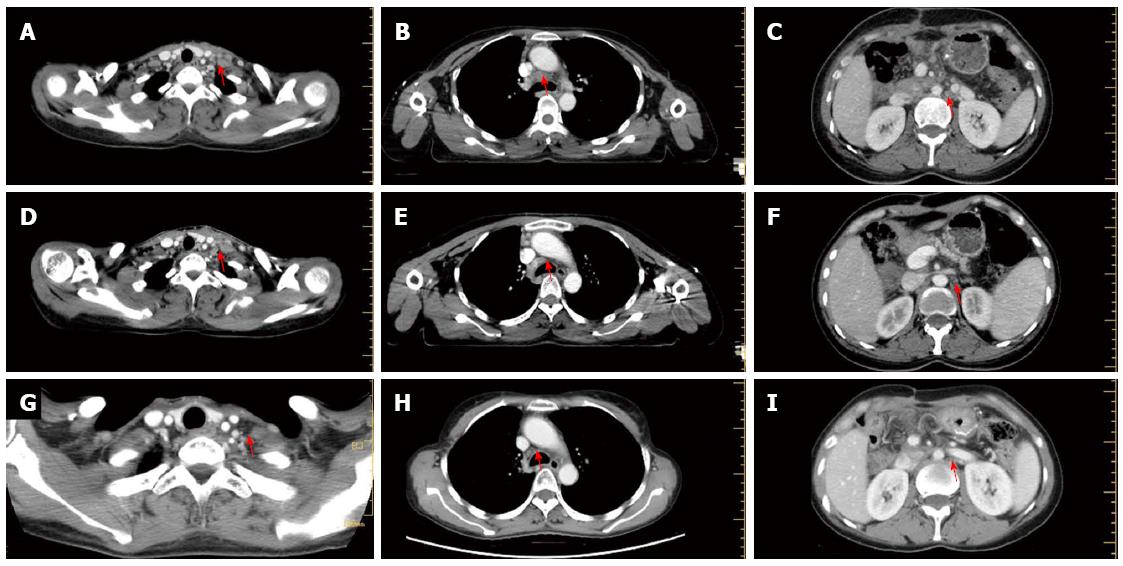
Figure 1 Computed tomography images of the recurrent lymph node metastases (red arrows).
A-C: At the time of recurrence (A: Cervical region; B: Mediastinal region; C: Retroperitoneal region); D-F: Images taken 1.5 mo after chemoradiotherapy (D: Cervical region; E: Mediastinal region; F: Retroperitoneal region); G-I: Images taken 2 years after treatment (G: Cervical region; H: Mediastinal region; I: Retroperitoneal region). The recurrent lymph nodes dramatically decreased in size 1.5 mo after treatment, and nearly disappeared 2 years after treatment.
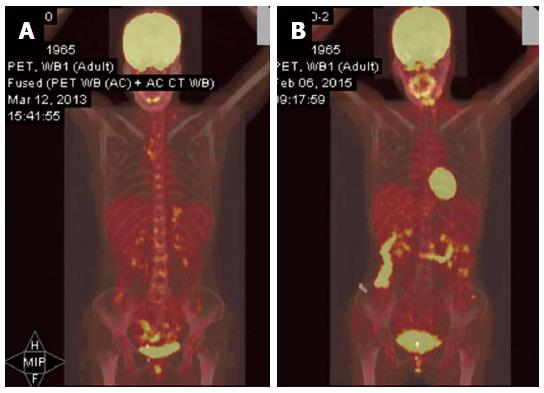
Figure 2 Positron emission tomography/computed tomography images of the patient.
A: Before treatment; B: Two years after chemoradiotherapy.
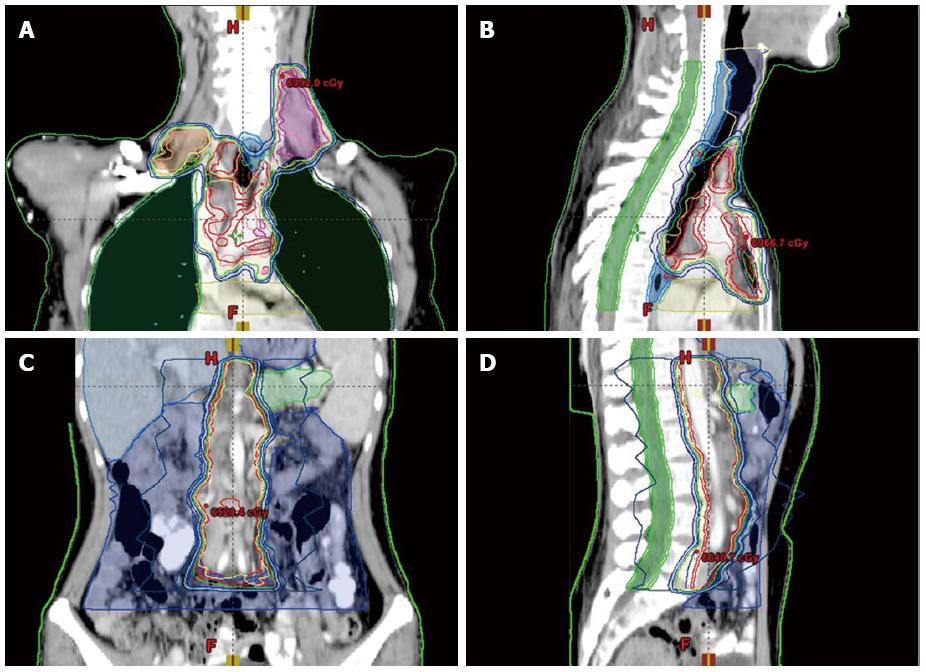
Figure 3 Initial radiation treatment plan showing isodose distribution images of the body.
A: Bilateral cervical area; B: Bilateral supraclavicular area; C: Mediastinal area; D: Retroperitoneal area.
- Citation: Li BS, Shi H, Wen M, Xiao MY, Wang J. Widespread lymph node recurrence of major duodenal papilla cancer following pancreaticoduodenectomy. World J Gastroenterol 2015; 21(48): 13593-13598
- URL: https://www.wjgnet.com/1007-9327/full/v21/i48/13593.htm
- DOI: https://dx.doi.org/10.3748/wjg.v21.i48.13593


