Copyright
©The Author(s) 2015.
World J Gastroenterol. Dec 28, 2015; 21(48): 13457-13465
Published online Dec 28, 2015. doi: 10.3748/wjg.v21.i48.13457
Published online Dec 28, 2015. doi: 10.3748/wjg.v21.i48.13457
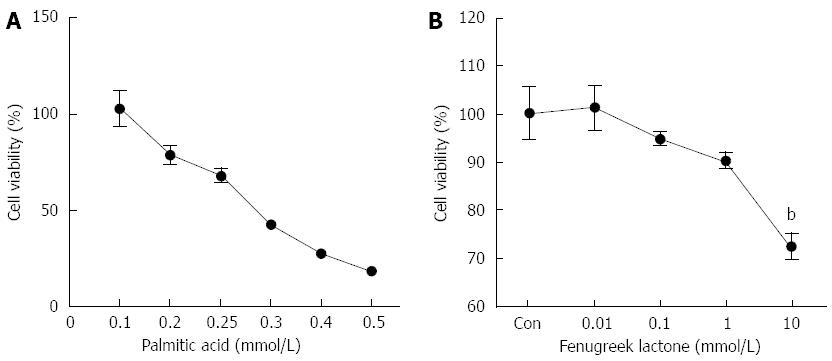
Figure 1 Viability of pancreatic NIT-1 β-cells exposed to various concentrations of palmitic acid (A) and fenugreek lactone (B).
To select the appropriate concentration of palmitate (PA), dose-response experiments were conducted (A). When NIT-1 cells were cultured in medium with 0.25 mmol/L PA for 24 h, the survival rate was between 60%-70%. (B) NIT-1 cells were treated with various concentrations of fenugreek lactone (FL) (0.01-10 μmol/L) for 24 h. The maximum non-toxic concentration of FL is 1 μmol/L. Data represent the mean ± SD. bP < 0.01 vs PA group.
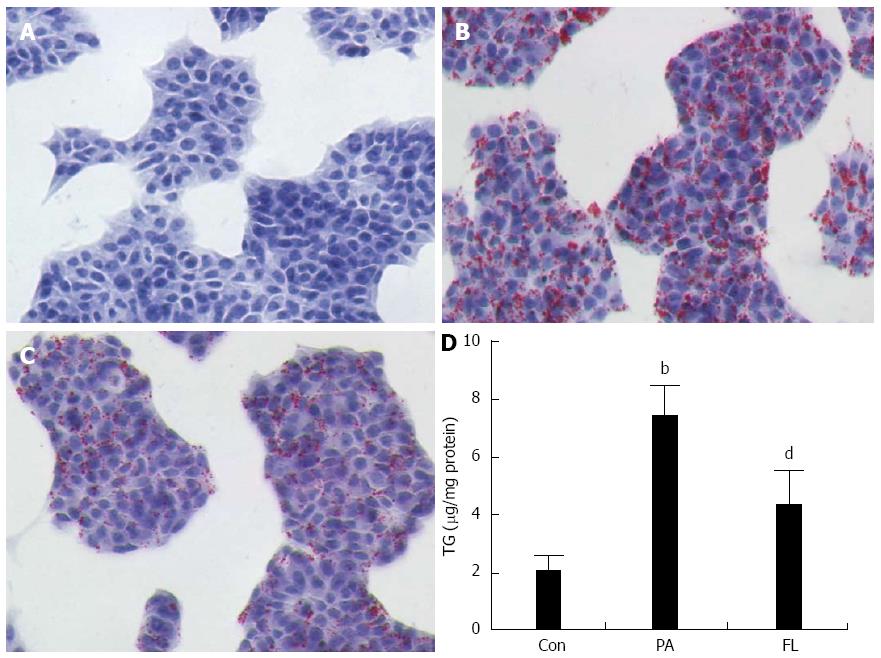
Figure 2 Effects of fenugreek lactone on palmitate-induced lipid accumulation in NIT-1 pancreatic β-cells.
A-C: Oil Red O staining of lipid droplets showed that palmitate (PA) induced a palpable increase in lipid accumulation, which was inhibited by the fenugreek lactone (FL) treatment (A: Control group; B: PA group; and C: FL-treated group); D: Intracellular triglyceride (TG) content extracted from NIT-1 cells. FL decreased intracellular TG content in NIT-1 pancreatic β-cells compared with PA group. CON refers to control group, PA refers to palmitic acid intervention group and FL refers to FL-treated group. Data are reported as the mean ± SD (n = 4). bP < 0.01 vs control group; dP < 0.01 vs PA group.
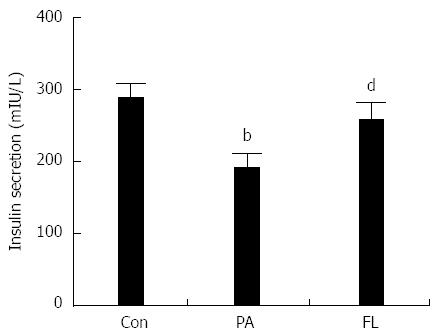
Figure 3 Effects of fenugreek lactone on glucose stimulated insulin secretion in NIT-1 pancreatic β-cells exposed to palmitate.
Insulin content in the supernatant was measured using a radio-immunoassay kit after the treatment. Insulin concentration was corrected with cell numbers. Data represent the mean ± SD from six wells. bP < 0.01 vs control group; dP < 0.01 vs PA alone. PA: Palmitate; FL: Fenugreek lactone.
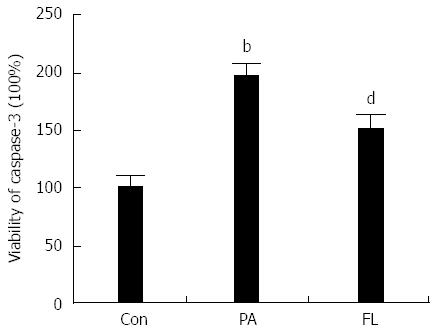
Figure 4 Effects of fenugreek lactone on caspase-3 viability in NIT-1 islet β-cells exposed to palmitate.
Each bar represents mean ± SD; bP < 0.01 vs control group; dP < 0.01 vs PA group. PA: Palmitate; FL: Fenugreek lactone.
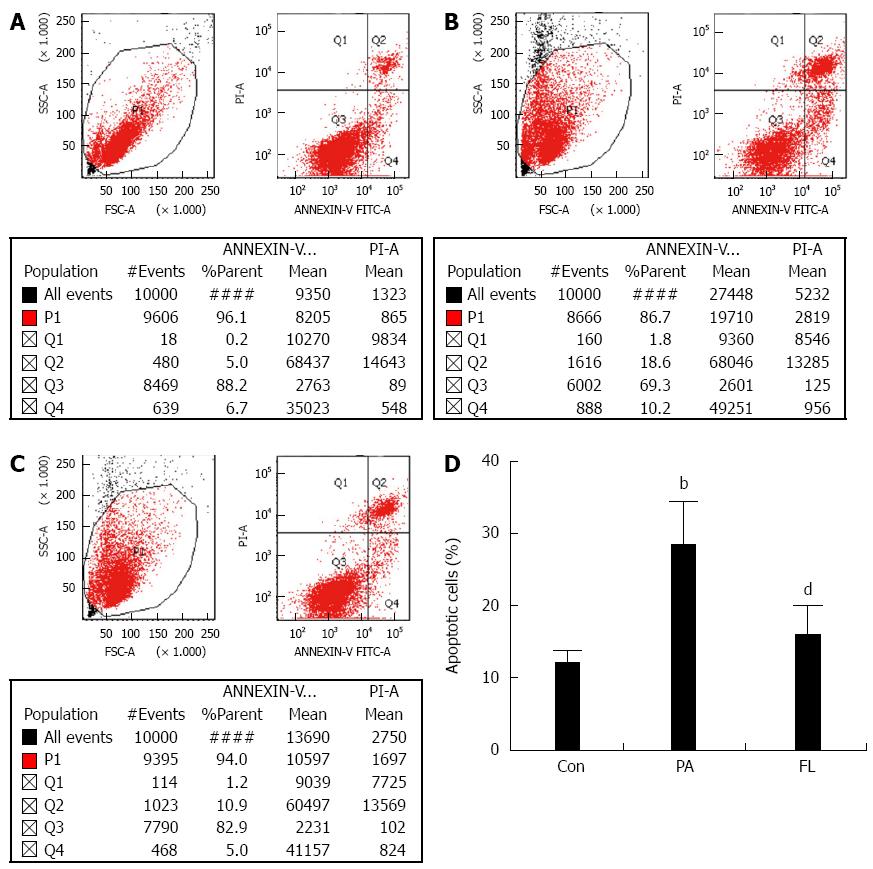
Figure 5 Comparison of apoptosis rates of NIT-1 cells by flow cytometry in different groups.
A: Control group; B: PA intervention group; C: FL-treated group; D: Data are reported as the mean ± SD of percentages from four wells. bP < 0.01 vs control group; dP < 0.01 vs PA group. PA: Palmitate; FL: Fenugreek lactone.
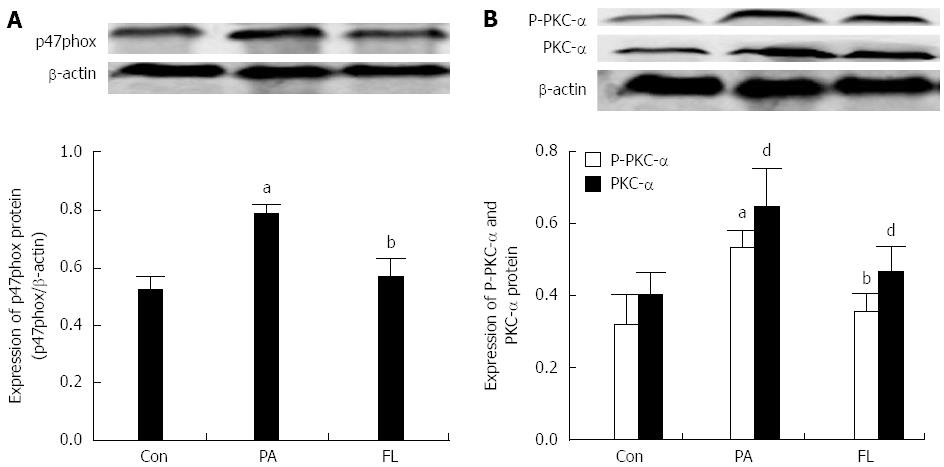
Figure 6 Effects of fenugreek lactone on protein expression of protein kinase C-α, P-protein kinase C-α and p47phox in NIT-1 β-cells exposed to palmitate.
Each bar is described as corresponding proteins/β-actin. FL supplementation inhibited the expression of above mentioned proteins. Representative gels and protein levels for (A) p47phox and PKC-α or P-PKC-α (B) were measured by Western blot in NIT-1 pancreatic β-cells. Data are shown as the mean ± SD. aP < 0.01 vs control group; bP < 0.01 vs PA group; dP< 0.01 vs PA group. PA: Palmitate; FL: Fenugreek lactone.
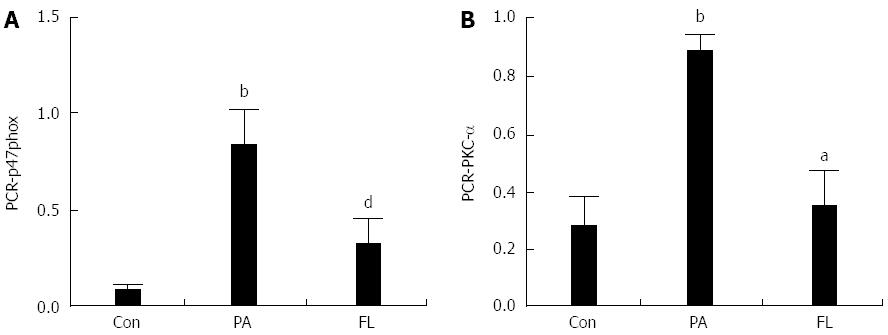
Figure 7 Effects of fenugreek lactone on mRNA levels of protein kinase C (A) and p47phox (B) in NIT-1 β-cells.
Each bar represents mean 2-ΔΔCT± SD (n = 3). bP < 0.01 vs control group; dP < 0.01 vs PA group; aP < 0.05 vs PA group. PA: Palmitate; FL: Fenugreek lactone.
- Citation: Gong J, Dong H, Jiang SJ, Wang DK, Fang K, Yang DS, Zou X, Xu LJ, Wang KF, Lu FE. Fenugreek lactone attenuates palmitate-induced apoptosis and dysfunction in pancreatic β-cells. World J Gastroenterol 2015; 21(48): 13457-13465
- URL: https://www.wjgnet.com/1007-9327/full/v21/i48/13457.htm
- DOI: https://dx.doi.org/10.3748/wjg.v21.i48.13457


