Copyright
©The Author(s) 2015.
World J Gastroenterol. Dec 21, 2015; 21(47): 13386-13395
Published online Dec 21, 2015. doi: 10.3748/wjg.v21.i47.13386
Published online Dec 21, 2015. doi: 10.3748/wjg.v21.i47.13386
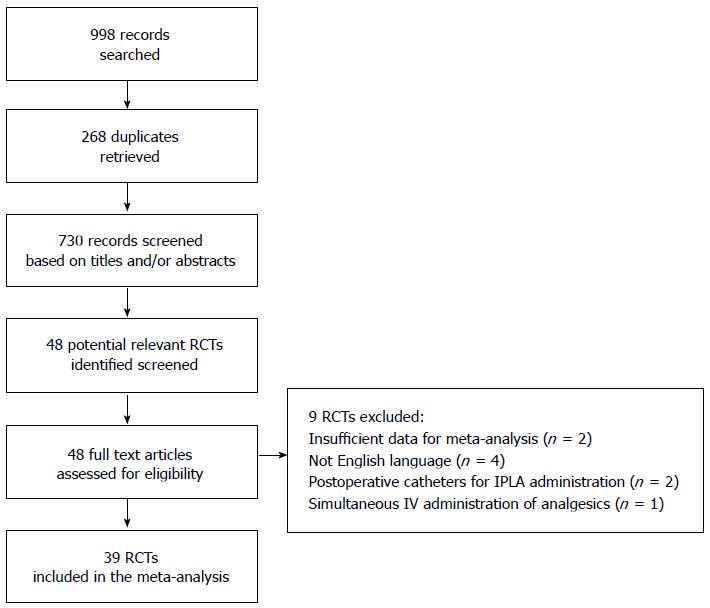
Figure 1 Flow diagram of studies identified and selected.
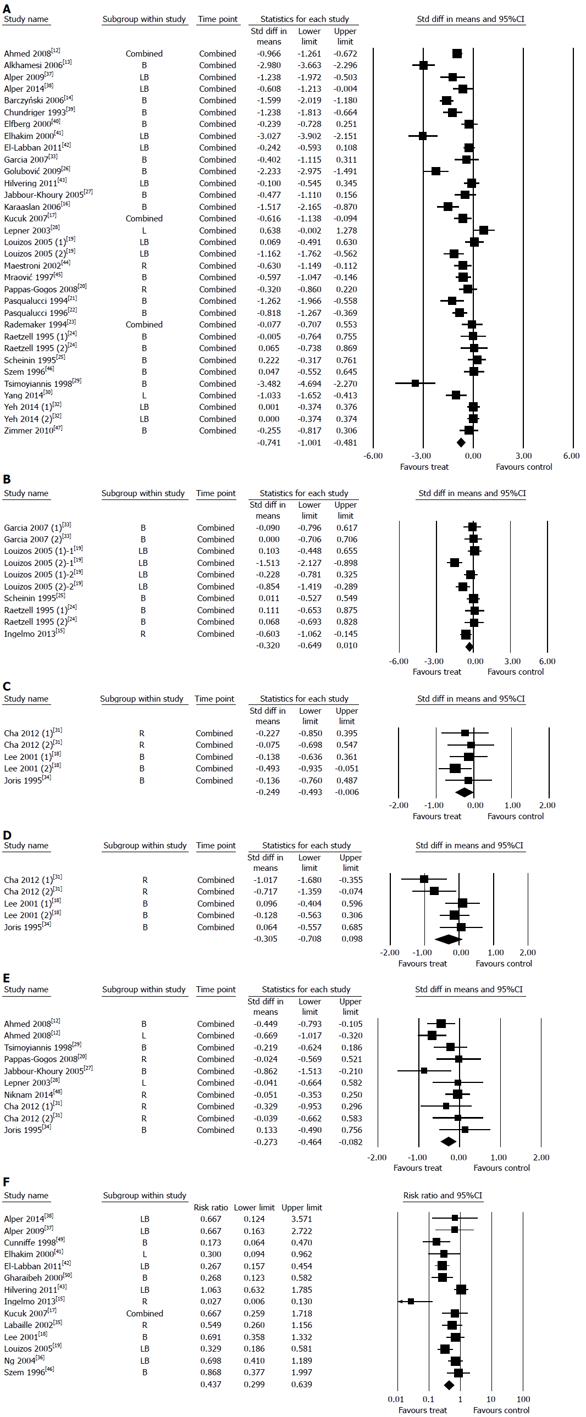
Figure 2 Forest plot of resting abdominal pain (A), dynamic abdominal pain (B), visceral pain (C), parietal pain (D), shoulder pain (severity) (E) and shoulder pain (incidence) (F).
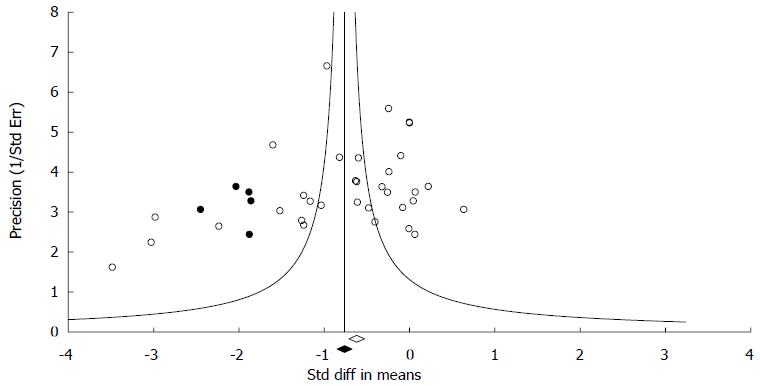
Figure 3 Funnel plot of publication bias of resting abdominal pain.
- Citation: Choi GJ, Kang H, Baek CW, Jung YH, Kim DR. Effect of intraperitoneal local anesthetic on pain characteristics after laparoscopic cholecystectomy. World J Gastroenterol 2015; 21(47): 13386-13395
- URL: https://www.wjgnet.com/1007-9327/full/v21/i47/13386.htm
- DOI: https://dx.doi.org/10.3748/wjg.v21.i47.13386


