Copyright
©The Author(s) 2015.
World J Gastroenterol. Dec 21, 2015; 21(47): 13277-13287
Published online Dec 21, 2015. doi: 10.3748/wjg.v21.i47.13277
Published online Dec 21, 2015. doi: 10.3748/wjg.v21.i47.13277
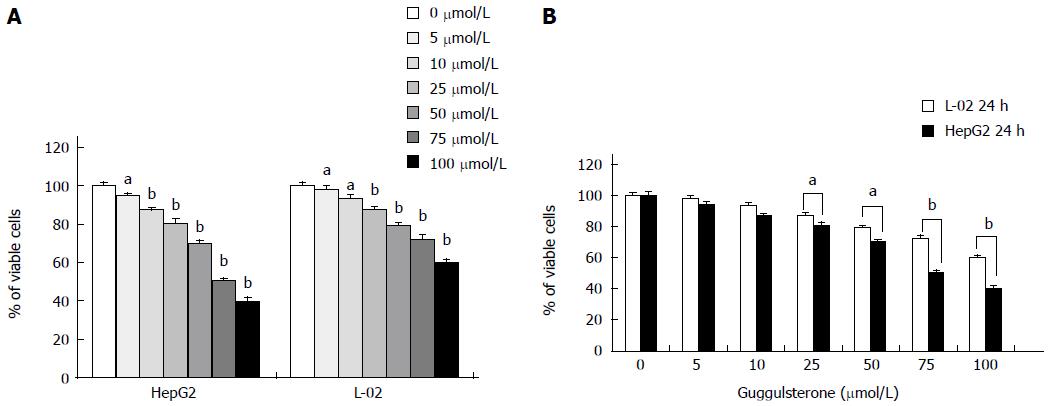
Figure 1 Human L-02 and HepG2 cells show different cell viabilities in response to guggulsterone treatment.
Cell viability in L-02 and HepG2 cells was determined using MTT assay after incubation with 5, 10, 25, 50, 75 and 100 μmol/L guggulsterone, respectively, for 24 h. Guggulsterone significantly reduced cell viability in both L-02 and HepG2 cells in a dose- and time-dependent manner (A). Same concentration of guggulsterone differently reduced cytotoxicity between L-02 and HepG2 cells (B). aP < 0.05 or bP < 0.01, vs the control group.
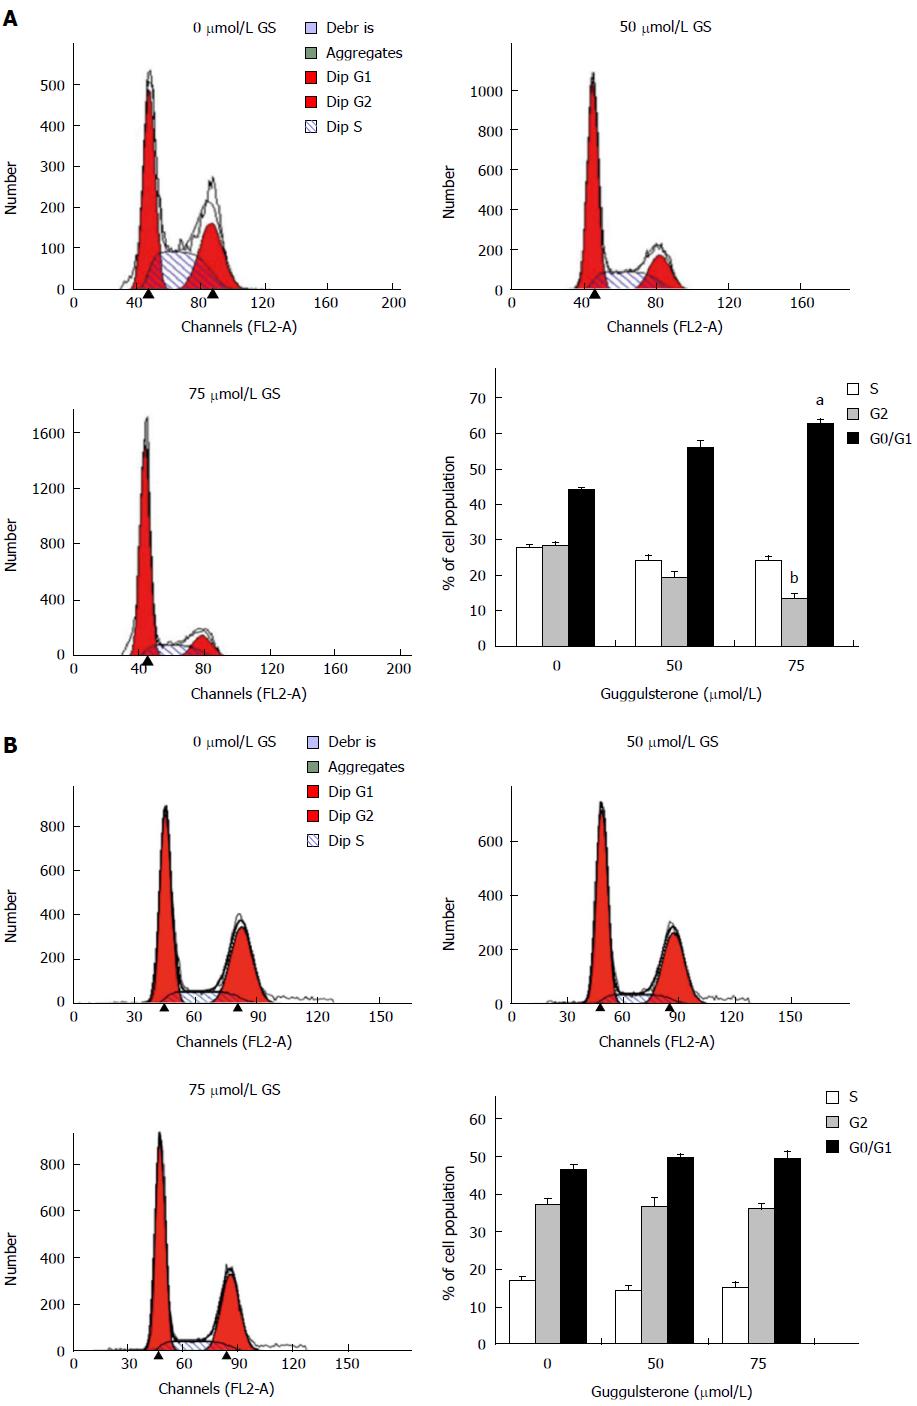
Figure 2 Guggulsterone alters cell cycle in human HepG2 and L-02 cells.
Human HepG2 (A) and L-02 cells (B) were treated with 0 μmol/L, 50 μmol/L and 75 μmol/L of GS for 24 h and the cell cycle was analyzed using flow cytometry, respectively. The histogram showed mean % of cell population in each phase of cell cycle. aP < 0.05 or bP < 0.01, vs the untreated control group.
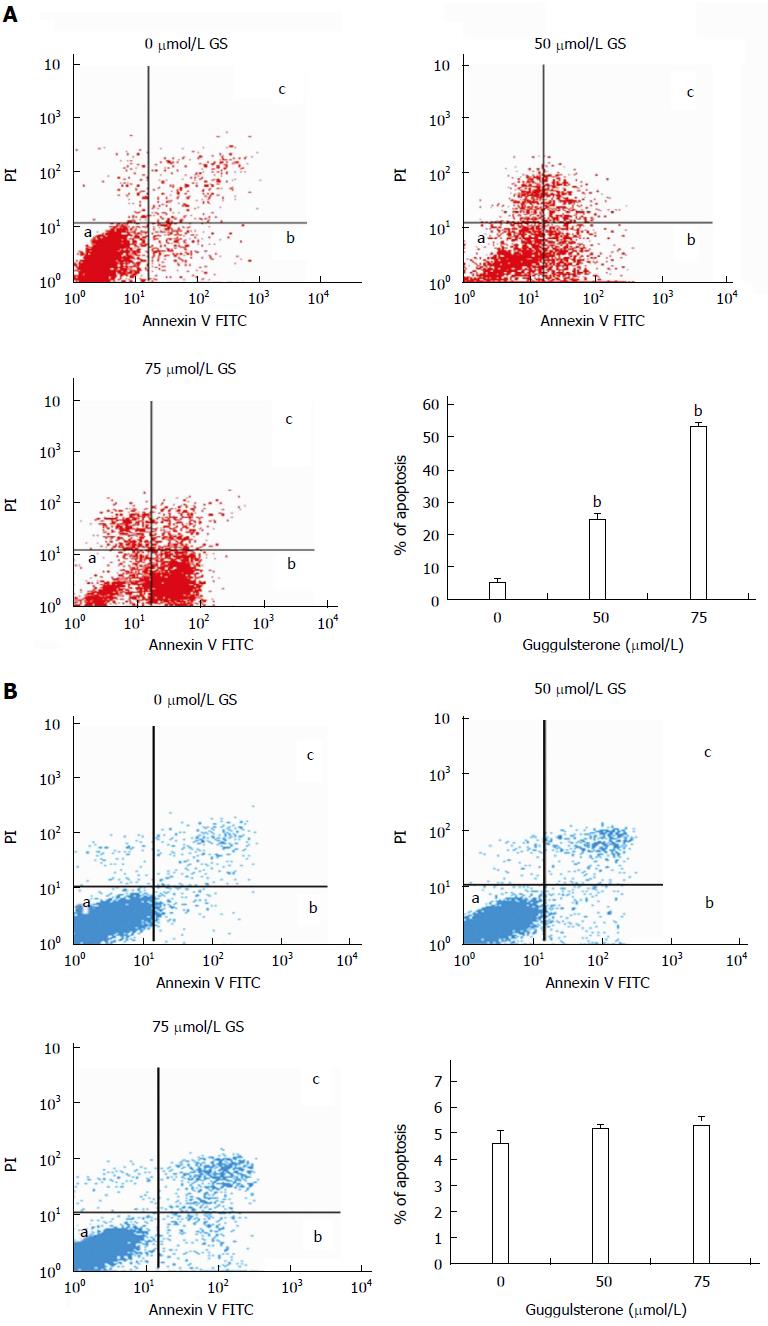
Figure 3 Guggulsterone induces apoptosis in human HepG2 and L-02 cells.
Human HepG2 (A) and L-02 cells (B) were treated with 0 μmol/L, 50 μmol/L and 75 μmol/L of GS for 24 h and cell apoptosis was investigated using annexin V-FITC and PI. GS significantly increased HepG2 cell apoptosis in a dose-dependent manner. bP < 0.01, vs the control group.
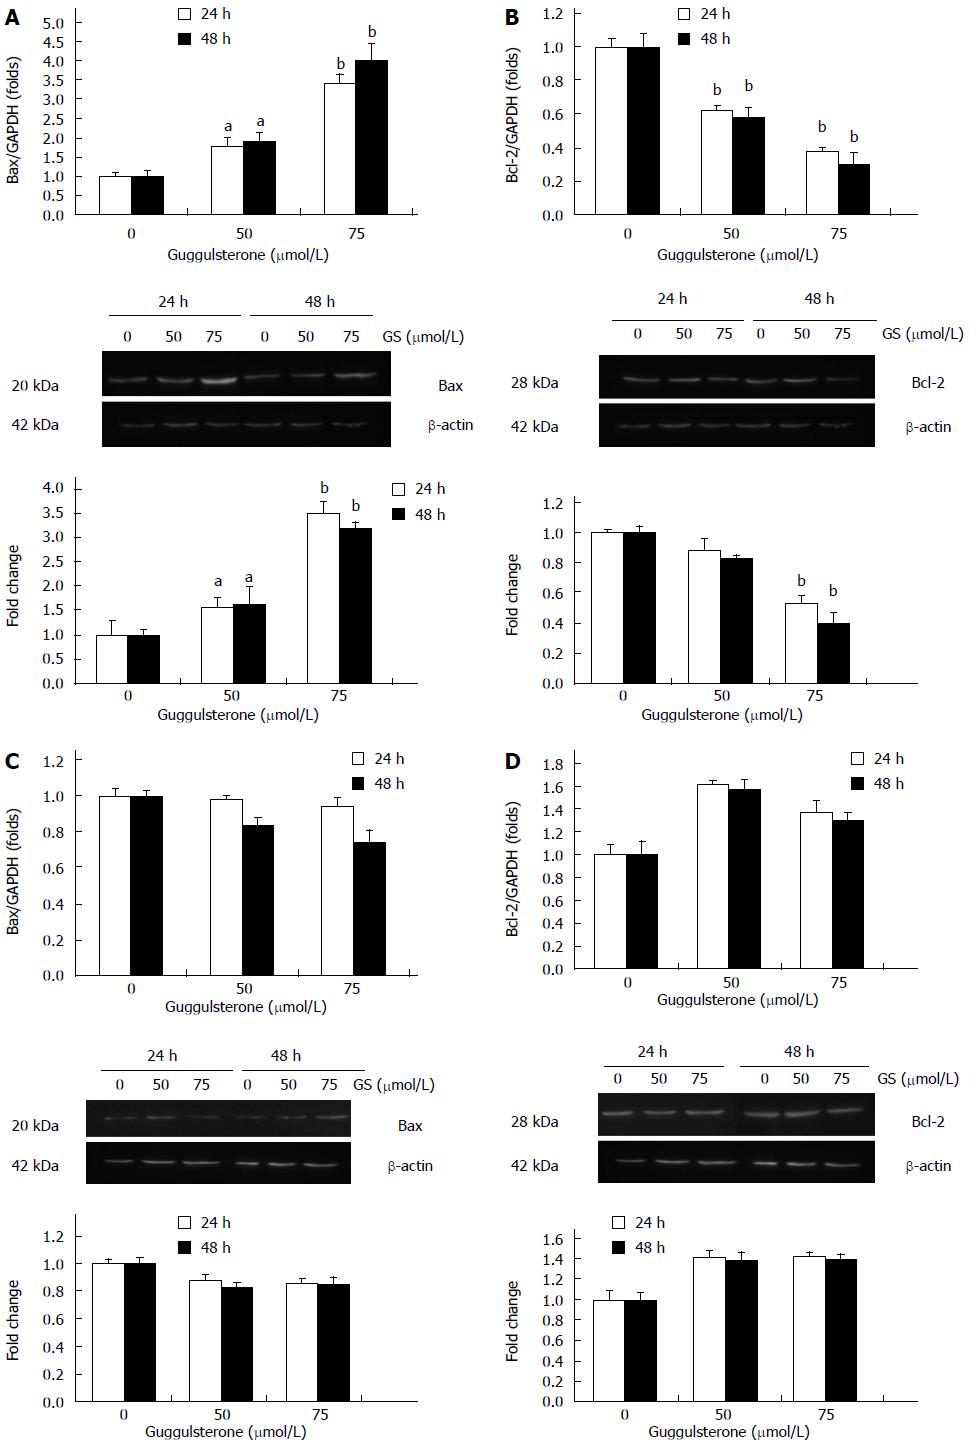
Figure 4 Guggulsterone differently alters Bax and Bcl-2 expression in HepG2 cell.
HepG2 (A and B) and L-02 cells (C and D) were treated with 0 μmol/L, 50 μmol/L and 75 μmol/L of GS for 24 and 48 h, respectively. Bax and Bcl-2 mRNA and protein levels were investigated using real-time PCR and Western blot, respectively. aP < 0.05 or bP < 0.01, vs the control group.
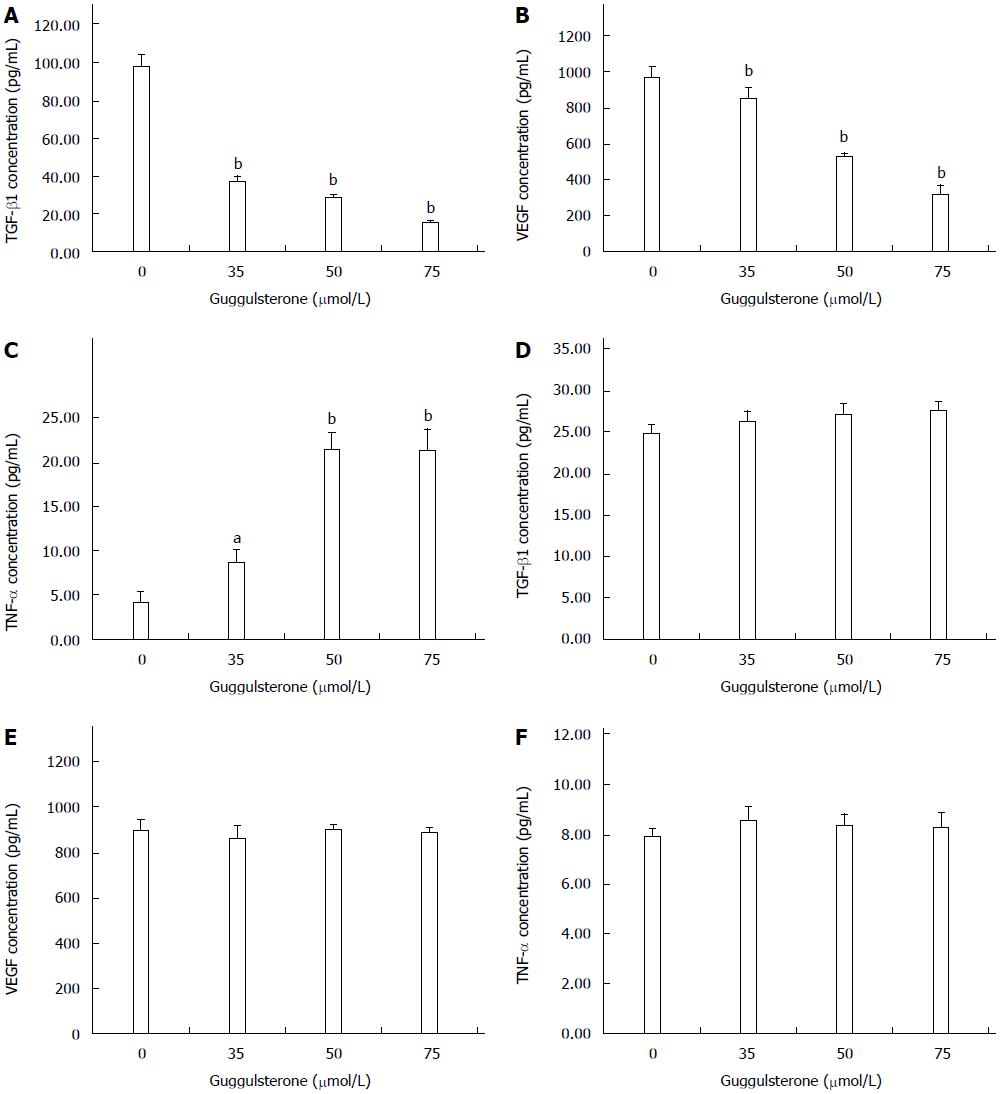
Figure 5 Guggulsterone alters TGF-β1, TNF-α and VEGF levels in HepG2 and L-02 cells.
HepG2 (A, B, and C) and L-02 cells (D, E, and F) were treated with 0, 35, 50 or 75 μmol/L of GS for 24 h, respectively. TGF-β1, TNF-α and VEGF levels in the culture medium were investigated using ELISA. aP < 0.05 or bP < 0.01, vs the control group.
- Citation: Shi JJ, Jia XL, Li M, Yang N, Li YP, Zhang X, Gao N, Dang SS. Guggulsterone induces apoptosis of human hepatocellular carcinoma cells through intrinsic mitochondrial pathway. World J Gastroenterol 2015; 21(47): 13277-13287
- URL: https://www.wjgnet.com/1007-9327/full/v21/i47/13277.htm
- DOI: https://dx.doi.org/10.3748/wjg.v21.i47.13277


