Copyright
©The Author(s) 2015.
World J Gastroenterol. Sep 21, 2015; 21(35): 10215-10223
Published online Sep 21, 2015. doi: 10.3748/wjg.v21.i35.10215
Published online Sep 21, 2015. doi: 10.3748/wjg.v21.i35.10215
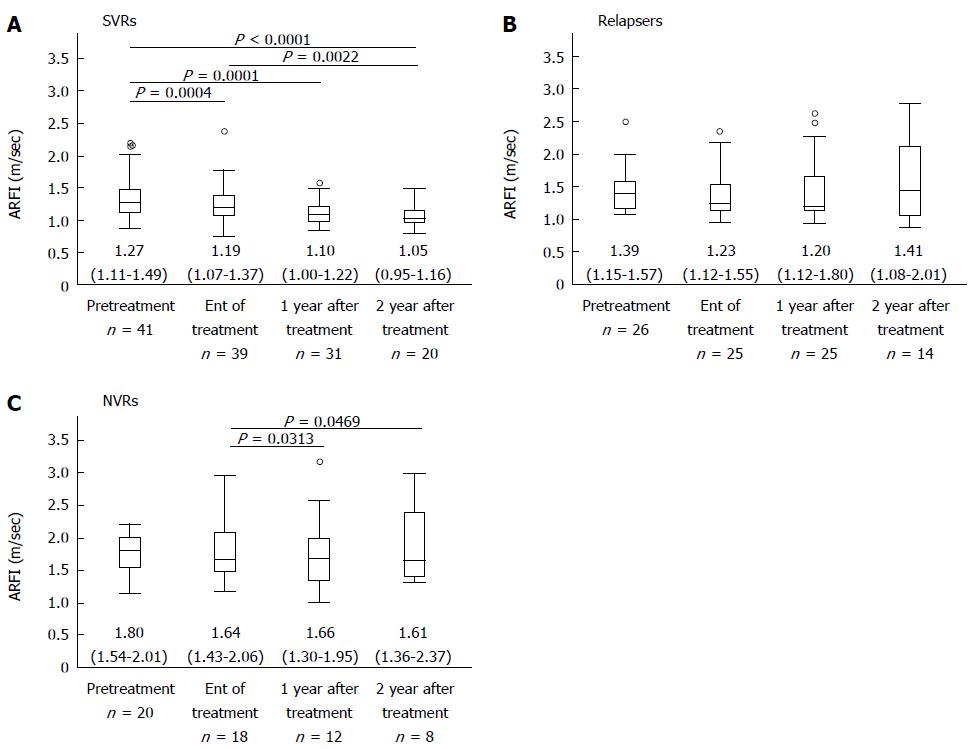
Figure 1 Changes of shear-wave velocity values after interferon plus ribavirin therapy.
The shear-wave velocity (Vs) values in the figure were expressed as overall medians. A: In SVR patients, Vs values were significantly lower at EOT [1.19 (1.07-1.36)] than at pretreatment [1.28 (1.11-1.51)] (P = 0.0004) in 39 patients in whom Vs values were measured at both points. Vs values were significantly lower at 1 year after treatment [1.10 (1.00-1.23)] than at pretreatment [1.27 (1.11-1.46)] (P = 0.0001) in 33 patients in whom Vs values were measured at both points. Vs values were significantly lower at 2 years after treatment [1.05 (0.96-1.16)] than at pretreatment [1.25 (0.97-1.47)] (P < 0.0001) in 22 patients in whom Vs values were measured at both points. Vs values were significantly lower at 1 year after treatment [1.07 (0.96-1.17)] than at EOT [1.20 (1.05-1.33)] (P = 0.0022) in 20 patients in whom Vs values were measured at both points; B: In patients who relapsed, Vs values did not significantly differ among pretreatment, EOT, 1 year, and 2 years after treatment; C: In patients with NVR, Vs values were significantly higher at 1 year after treatment [1.72 (1.43-2.00)] than at EOT [1.56 (1.25-1.75)] (P = 0.0313) in 11 patients in whom Vs values were measured at both points. Vs values were significantly higher at 2 years after treatment [1.58 (1.40-1.66)] than at EOT [1.37(1.23-1.57)] (P = 0.0469) in 7 patients in whom Vs was measured in both points.
- Citation: Osakabe K, Ichino N, Nishikawa T, Sugiyama H, Kato M, Shibata A, Asada W, Kawabe N, Hashimoto S, Murao M, Nakano T, Shimazaki H, Kan T, Nakaoka K, Takagawa Y, Ohki M, Kurashita T, Takamura T, Yoshioka K. Changes of shear-wave velocity by interferon-based therapy in chronic hepatitis C. World J Gastroenterol 2015; 21(35): 10215-10223
- URL: https://www.wjgnet.com/1007-9327/full/v21/i35/10215.htm
- DOI: https://dx.doi.org/10.3748/wjg.v21.i35.10215


