Copyright
©The Author(s) 2015.
World J Gastroenterol. Aug 21, 2015; 21(31): 9442-9447
Published online Aug 21, 2015. doi: 10.3748/wjg.v21.i31.9442
Published online Aug 21, 2015. doi: 10.3748/wjg.v21.i31.9442
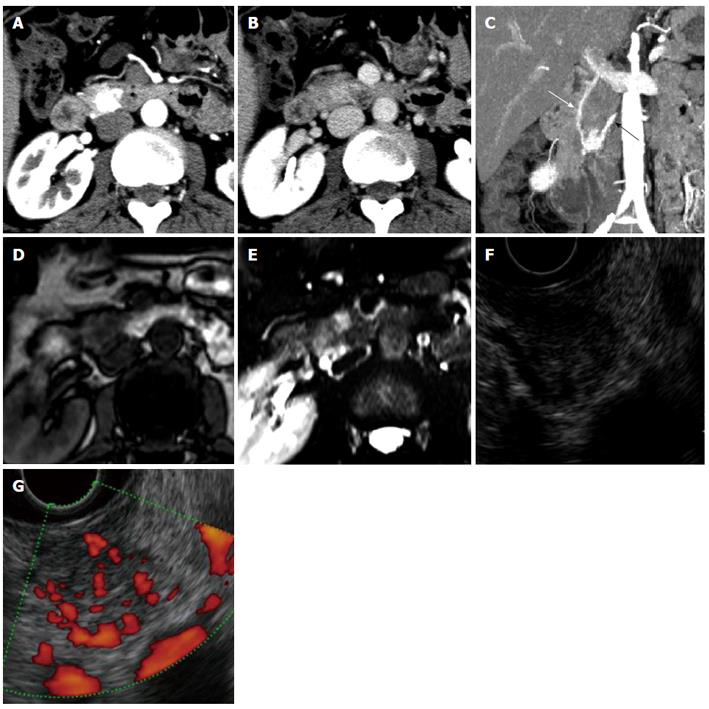
Figure 1 Images of the pancreatic tumour.
A: Dynamic computed tomography (CT) in the arterial phase; B: Dynamic CT in the portal phase. 1.5-cm well demarcated tumour at the pancreas head was very strongly enhanced in the arterial phase and still faintly enhanced in the portal phase; C: Maximum intensity projection of the arterial phase in a coronal view. Black arrow indicates the feeding artery from the inferior pancreaticoduodenal artery and white arrow indicates the draining vein into the portal vein; D: T1-weighted (T1W) magnetic resonance image (MRI); E: T2-weighted (T2W) MRI. The tumour appeared as a low-intensity lesion in T1W and as a high-intensity lesion in T2W; F: Endoscopic ultrasonography (EUS) images without power flow scanning; G: EUS images with power flow scanning. The low and uneven echoic tumour was surrounded by draining vessels.
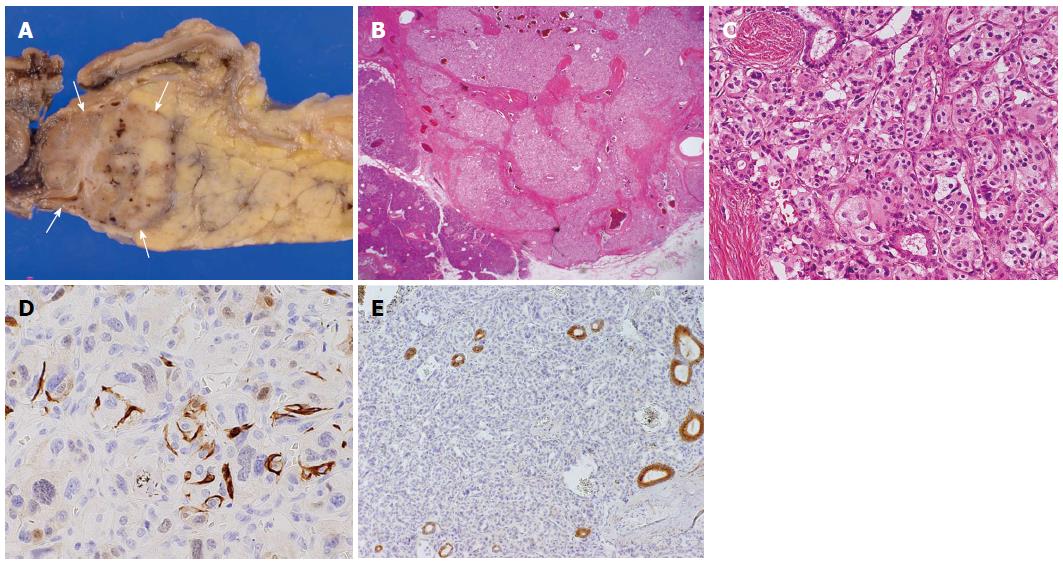
Figure 2 Histological examinations of the pancreatic tumour.
A: Macroscopic findings of the resected specimen. Arrows indicate the tumour in the pancreas head; B, C: Hematoxylin and eosin staining showing tumour cells in a Zellballen pattern at magnifications of × 10 (B) and × 200 (C); D: Immunohistochemistry of S-100 protein displaying S-100 protein-positive sustentacular cells surrounding the tumour cells (magnification × 200); E: Immunohistochemistry of epithelial membrane antigen displaying pancreatic duct branches remaining within the tumour (magnification × 100).
- Citation: Misumi Y, Fujisawa T, Hashimoto H, Kagawa K, Noie T, Chiba H, Horiuchi H, Harihara Y, Matsuhashi N. Pancreatic paraganglioma with draining vessels. World J Gastroenterol 2015; 21(31): 9442-9447
- URL: https://www.wjgnet.com/1007-9327/full/v21/i31/9442.htm
- DOI: https://dx.doi.org/10.3748/wjg.v21.i31.9442


