Copyright
©The Author(s) 2015.
World J Gastroenterol. Aug 21, 2015; 21(31): 9348-9357
Published online Aug 21, 2015. doi: 10.3748/wjg.v21.i31.9348
Published online Aug 21, 2015. doi: 10.3748/wjg.v21.i31.9348
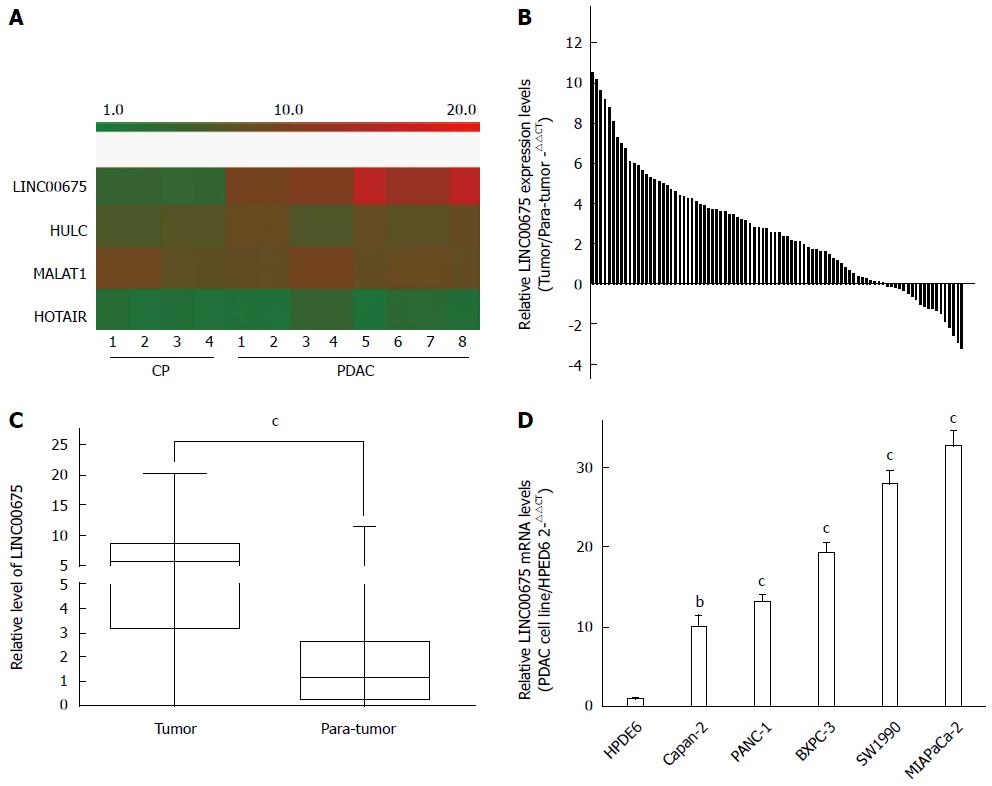
Figure 1 Expression of linc00675 in human pancreatic ductal adenocarcinoma cell lines and cancerous tissues.
A: Heat map showing linc00675, HULC, MALAT1, and HOTAIR expression in the microarray analysis. The rectangular indicates the hybridization signal (replicate probes) of linc00675 in pancreatic ductal adenocarcinoma (PDAC) and chronic pancreatitis (CP) tissues; B: Quantitative real time-polymerase chain reaction analysis of linc00675 expression level in 90 cases of PDAC tissues. GAPDH was used as an internal control; C: The boxes represent the distribution of linc00675 expression from the 25th to 75th percentiles of all patient samples with the horizontal lines showing the median levels of linc00675, cP < 0.001, tumor vs para-tumor, Student’s t-test; D: Relative abundance of linc00675 in multiple pancreatic cancer cell lines. Data are represented as the mean ± SD from three independent experiments, bP < 0.01, cP < 0.001, the corresponding pancreatic cancer cell line vs HPDE6, Student’s t-test.
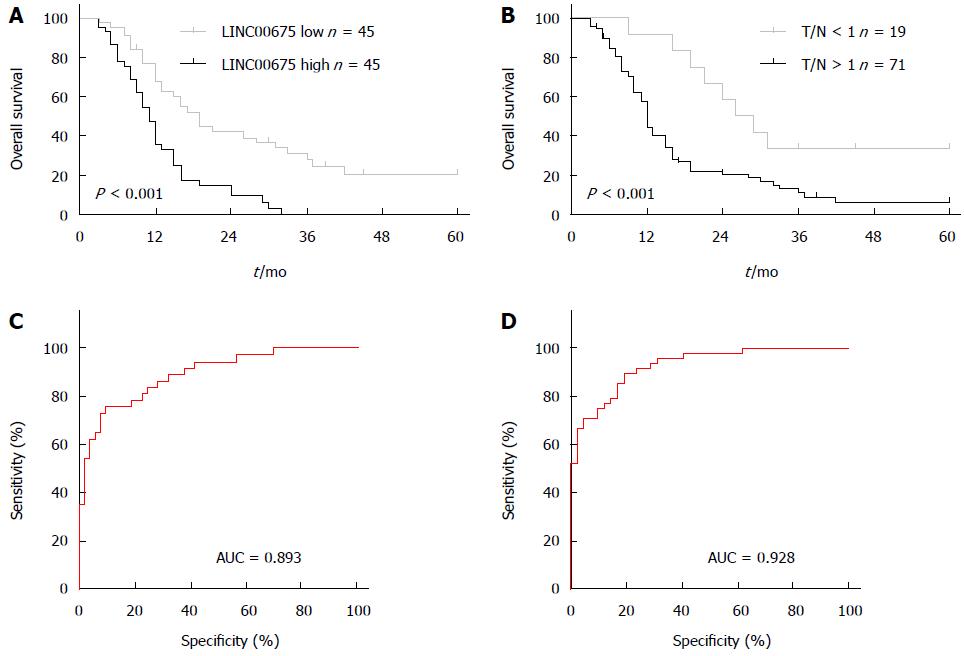
Figure 2 Overall survival of patients with pancreatic ductal adenocarcinoma based on linc00675 expression status and ROC curves of pancreatic ductal adenocarcinoma patients based on linc00675 for predicting recurrence.
A: Pancreatic ductal adenocarcinoma (PDAC) patients were equally divided into two groups based on linc00675 mRNA levels, and then Kaplan-Meier survival curves were employed for comparing overall survival between two groups; B: Overall survival of patients with PDAC was evaluated via Kaplan-Meier survival curves based on whether linc00675 was increased in tumor tissues compared with paired non-cancerous tissue; C: ROC curves of PDAC patients based on linc00675 for predicting recurrence within one year; D: ROC curves of PDAC patients based on linc00675 for predicting recurrence within 6 mo.
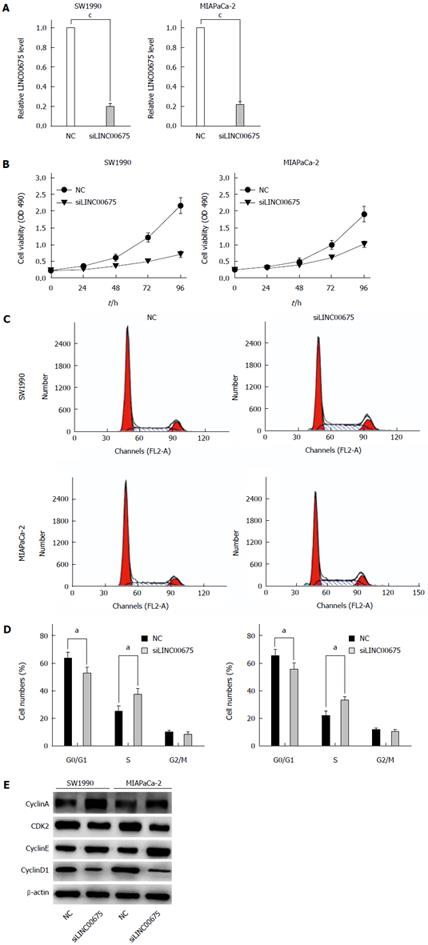
Figure 3 Effect of linc00675 knockdown on pancreatic ductal adenocarcinoma growth in vitro.
A: Knockout efficiency of siRNA targeting Linc00675 was confirmed by quantitative real time-polymerase chain reaction in SW1990 and MIA PaCa-2 cell lines, cP < 0.001, NC vs siLINC00675, Student’s t-test; B: Effects of knockdown of linc00675 on the proliferation of SW1990 and MIA PaCa-2 cells were assessed with MTT assay; C: Cell cycle of SW1990 and MIA PaCa-2 was analyzed by flow cytometry 48 h after transfection; D: Effect of knockdown of linc00675 on percentage of cells in G1-G0, S, and G2-M phase was examined quantitatively, aP < 0.05, NC vs siLINC00675, Student’s t-test; E: Cells were untreated, or transfected with linc00675, then the expression of CyclinA, CDK2, CyclinE and CyclinD1 was detected by Western blot. Data are represented as the mean ± SD from three independent experiments.
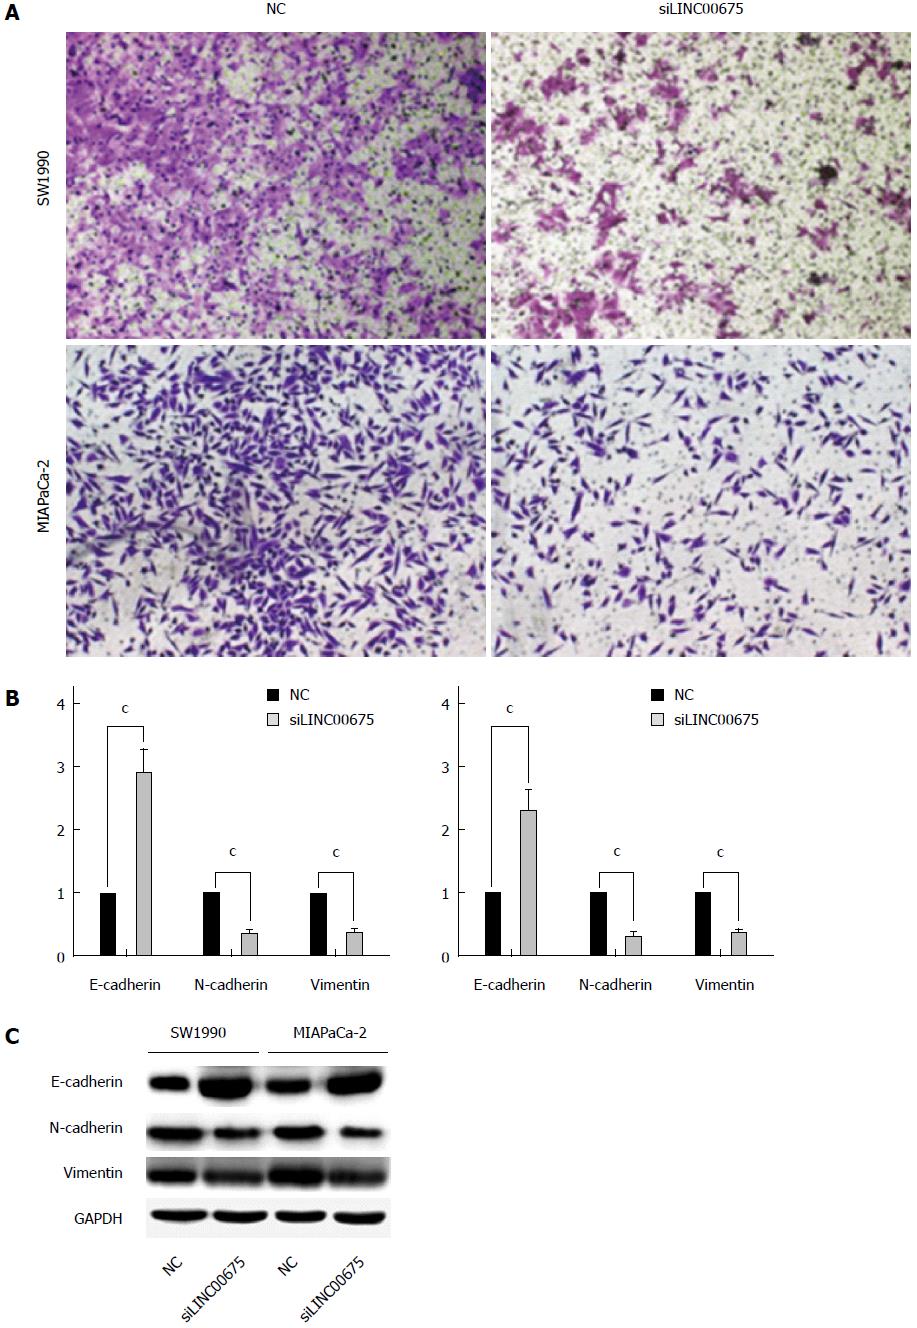
Figure 4 Effect of linc00675 knockdown on pancreatic ductal adenocarcinoma cell invasiveness in vitro.
A: Representative images of transwell assay after linc00675 knockdown in pancreatic cancer cell line SW1990 and MIA PaCa-2; B: Quantitative real time-polymerase chain reaction analysis of E-cadherin, N-cadherin and Vimentin was performed in SW1990 and MIA PaCa-2 cells at 72 h after transfection; cP < 0.001, NC vs siLINC00675, Student’s t-test; C: Western blot analysis of E-cadherin, N-cadherin and Vimentin was performed in SW1990 and MIA PaCa-2 cells at 72 h after transfection. Data are represented as the mean ± SD from three independent experiments.
- Citation: Li DD, Fu ZQ, Lin Q, Zhou Y, Zhou QB, Li ZH, Tan LP, Chen RF, Liu YM. Linc00675 is a novel marker of short survival and recurrence in patients with pancreatic ductal adenocarcinoma. World J Gastroenterol 2015; 21(31): 9348-9357
- URL: https://www.wjgnet.com/1007-9327/full/v21/i31/9348.htm
- DOI: https://dx.doi.org/10.3748/wjg.v21.i31.9348


