Copyright
©The Author(s) 2015.
World J Gastroenterol. Aug 14, 2015; 21(30): 9209-9216
Published online Aug 14, 2015. doi: 10.3748/wjg.v21.i30.9209
Published online Aug 14, 2015. doi: 10.3748/wjg.v21.i30.9209
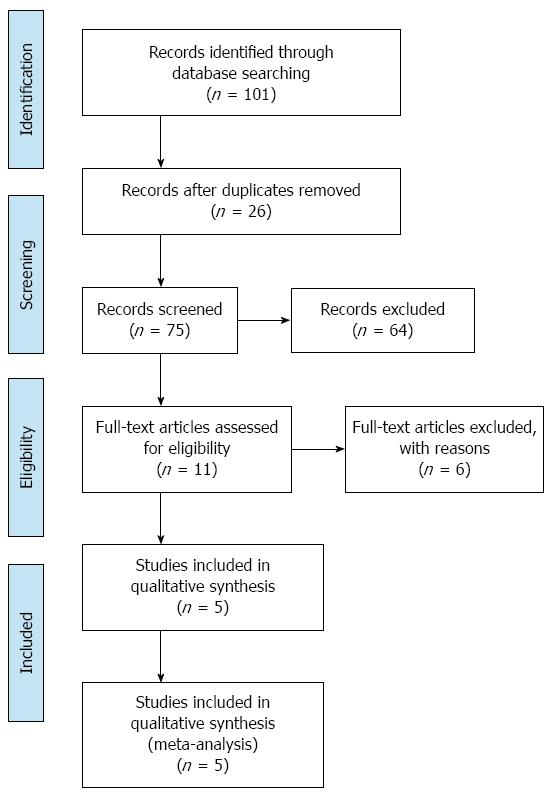
Figure 1 Preferred reporting items for systematic reviews and meta-analyses flow diagram.
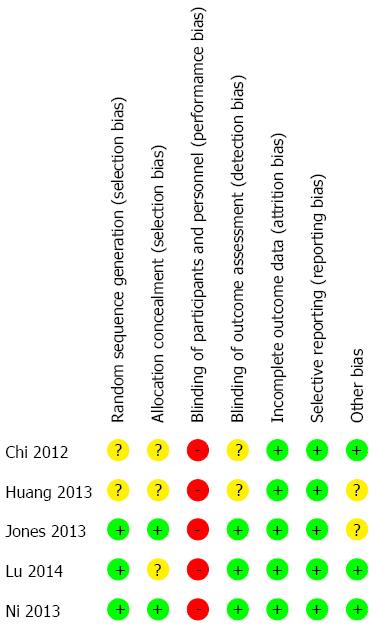
Figure 2 Risk of bias summary in included studies.
The symbol of (-) red indicates that there is a high risk of bias, of (+) green indicates a low risk of bias and of (?) yellow indicates uncertainty.
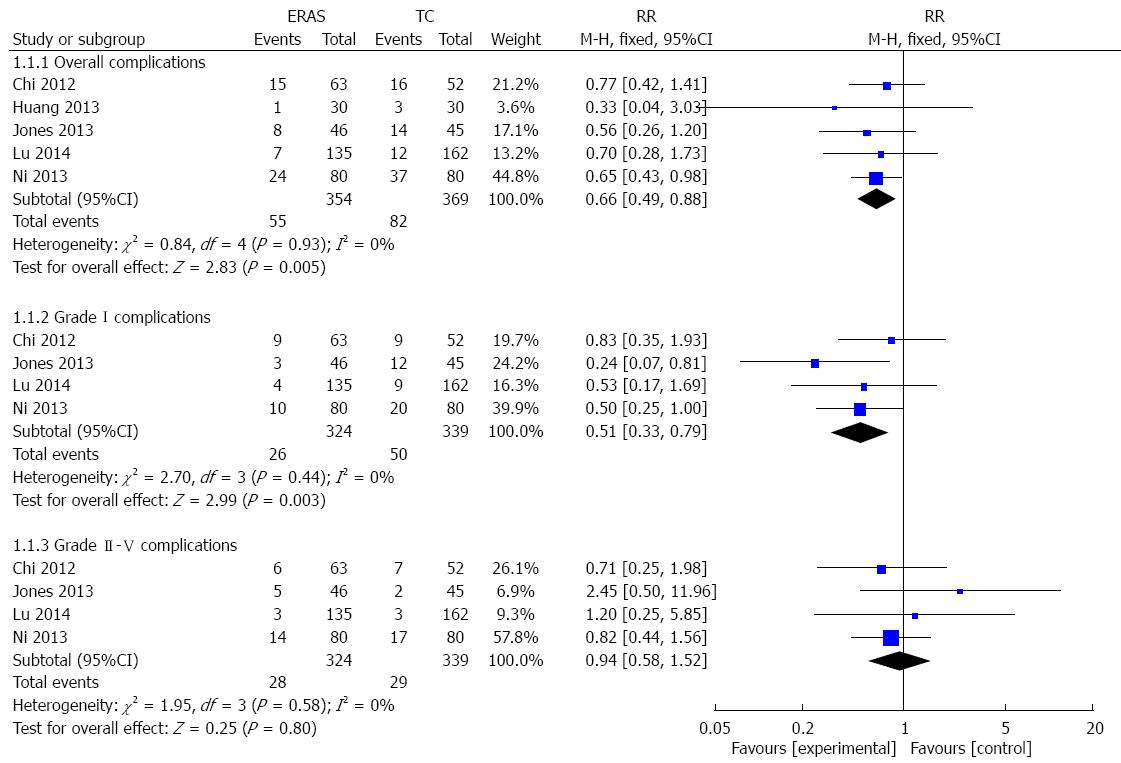
Figure 3 Forest plot of enhanced recovery after surgery programs vs traditional care for patient complications.
ERAS: Enhanced recovery after surgery; TC: Traditional care.
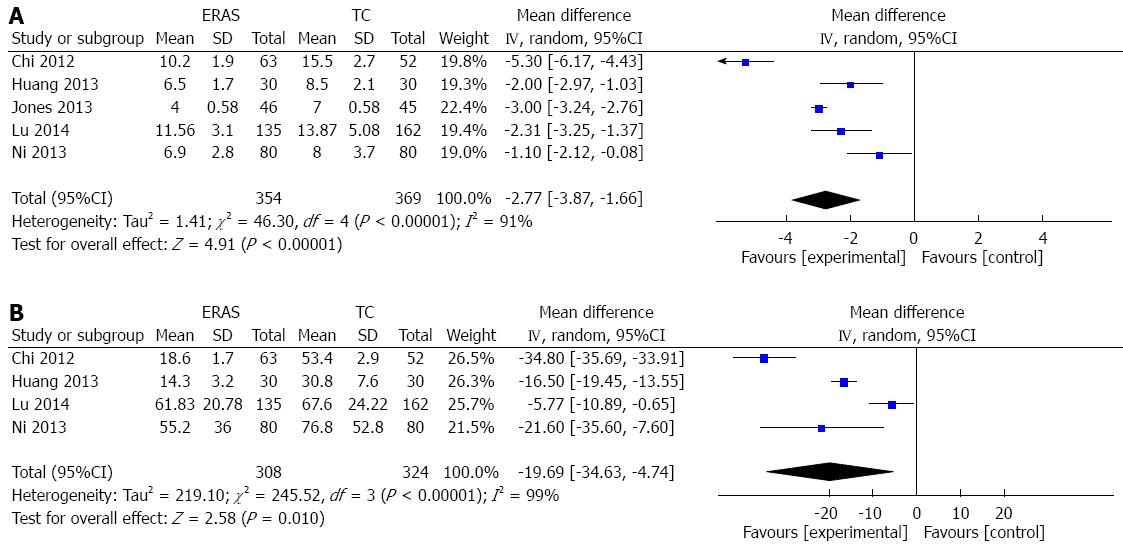
Figure 4 Forest plots of enhanced recovery after surgery programs vs traditional care for hospital length of stay (A) and time to first flatus (B).
ERAS: Enhanced recovery after surgery; TC: Traditional care.
- Citation: Ni TG, Yang HT, Zhang H, Meng HP, Li B. Enhanced recovery after surgery programs in patients undergoing hepatectomy: A meta-analysis. World J Gastroenterol 2015; 21(30): 9209-9216
- URL: https://www.wjgnet.com/1007-9327/full/v21/i30/9209.htm
- DOI: https://dx.doi.org/10.3748/wjg.v21.i30.9209


