Copyright
©The Author(s) 2015.
World J Gastroenterol. Aug 14, 2015; 21(30): 9055-9066
Published online Aug 14, 2015. doi: 10.3748/wjg.v21.i30.9055
Published online Aug 14, 2015. doi: 10.3748/wjg.v21.i30.9055
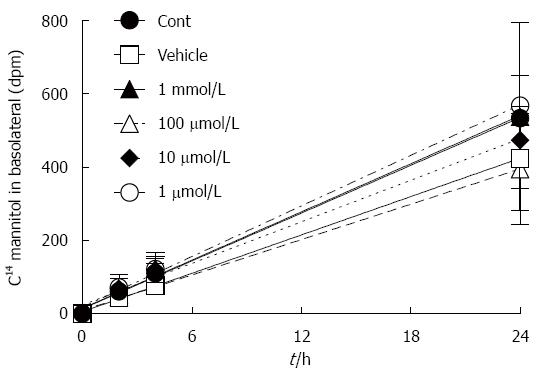
Figure 1 Baseline mannitol flux.
Mannitol flux was not influenced by calcium glycerophosphate at any concentration tested, as determined by 2-way analysis of variance. Data represent the mean of three independent experiments.
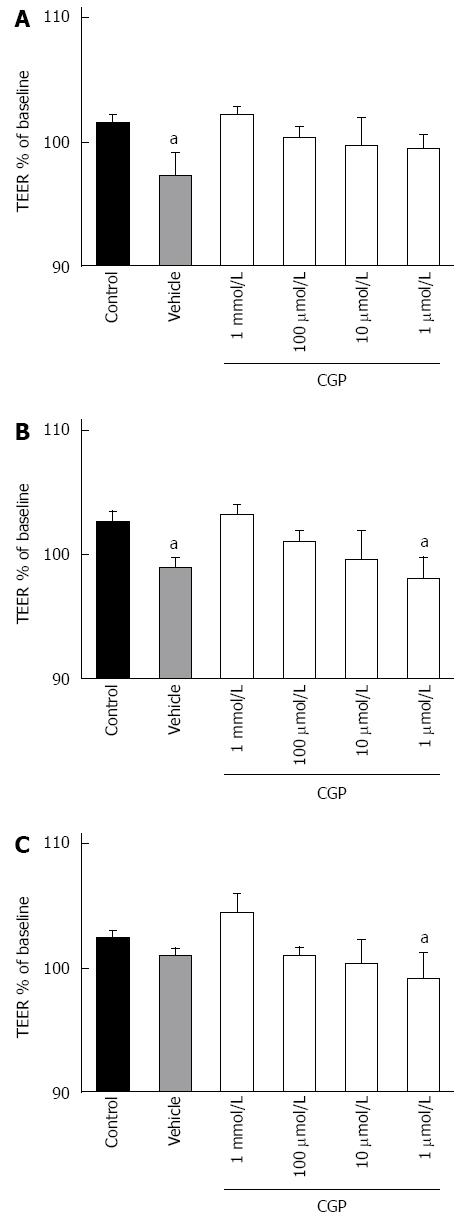
Figure 2 Trans epithelial electric resistance.
The vehicle (0.1% citric acid) reduced trans epithelial electric resistance (TEER) slightly, but significantly (aP < 0.05 vs control) at A: two and B: four hours. In the presence of 10 μmol/L to 1 mmol/L calcium glycerophosphate, TEER was not different from control at any time point. Data were analyzed by two-way analysis of variance followed by Dunnett’s multiple comparison tests; C: 24 h.
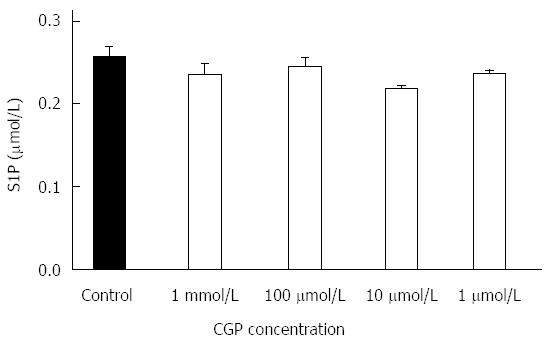
Figure 3 Effect of calcium glycerophospate on sphingosine 1 phosphate.
Calcium glycerophospate (CGP) had no significant effect on sphingosine 1 phosphate (S1P) concentrations. The mean results of 3 independent experiments are shown; data were analyzed by one-way analysis of variance followed by Dunnett’s test for multiple comparisons.
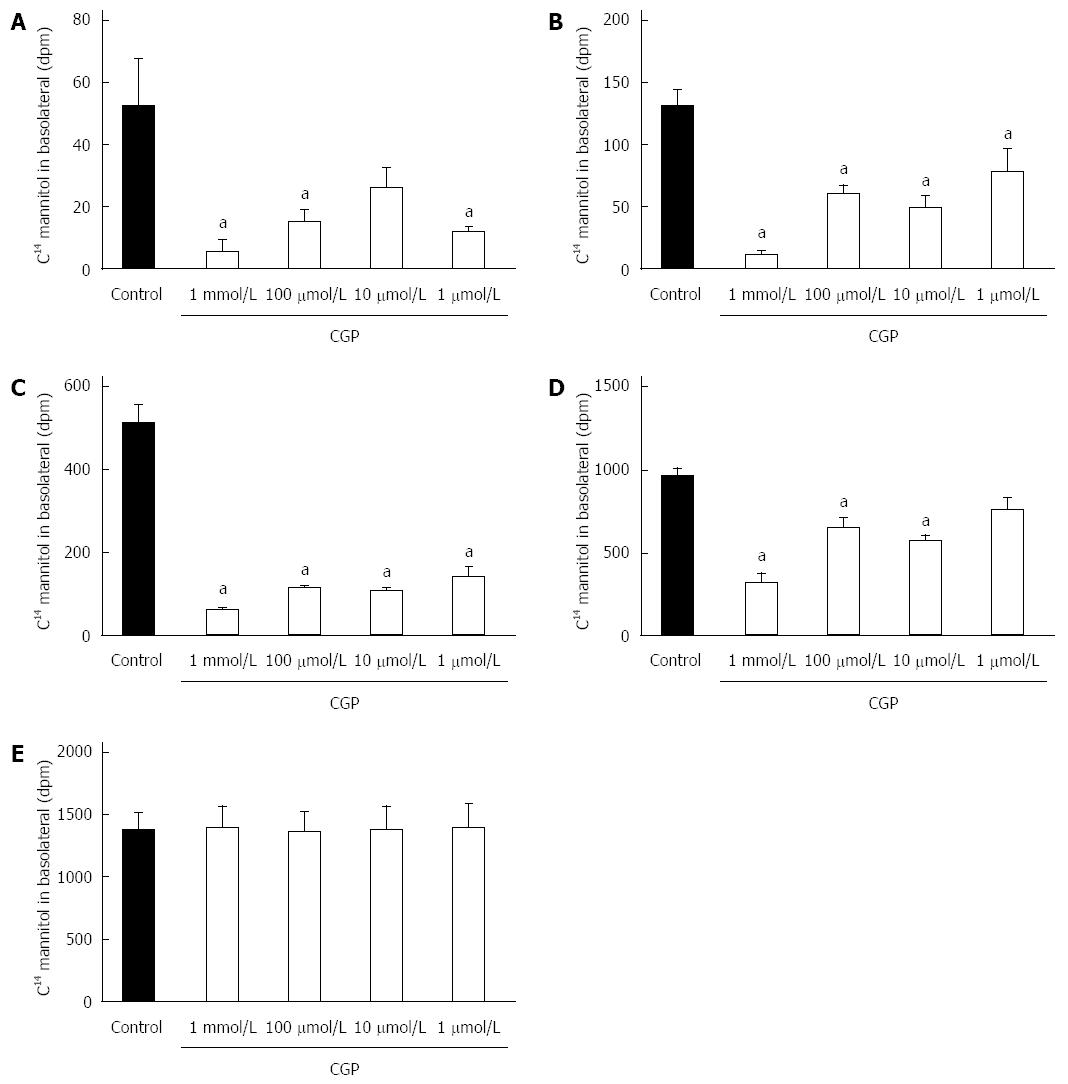
Figure 4 Effect of hypoxia on mannitol flux.
Mannitol flux during hypoxia increased significantly for all groups. Calcium glycerophospate attenuated the rate of mannitol flux in a concentration dependent fashion. A: 1 h; B: 2 h; C: 3 h; D: 4 h; E: 5 h. aP < 0.05, vs control.
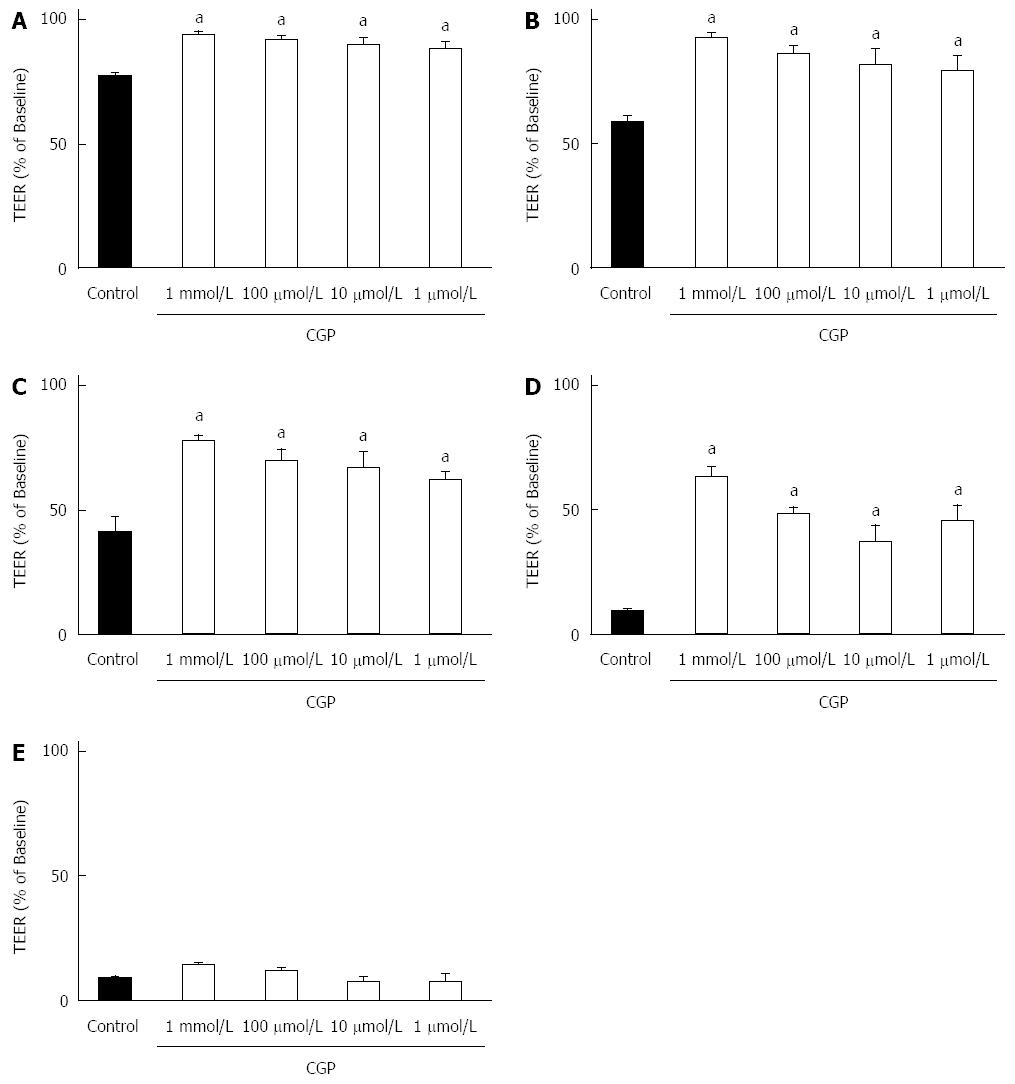
Figure 5 Effect on trans epithelial electric resistance during hypoxia.
Trans epithelial electric resistance (TEER) decreased significantly during hypoxia for all groups. However, calcium glycerophosphate (CGP) attenuated the rate of decrease in a concentration dependent manner. Each concentration represents data from three independent experiments. Data were analyzed by two-way analysis of variance, followed by Tukey’s multiple comparisons test. A: 1 h; B: 2 h; C: 3 h; D: 4 h; E: 5 h. aP < 0.05, vs control.
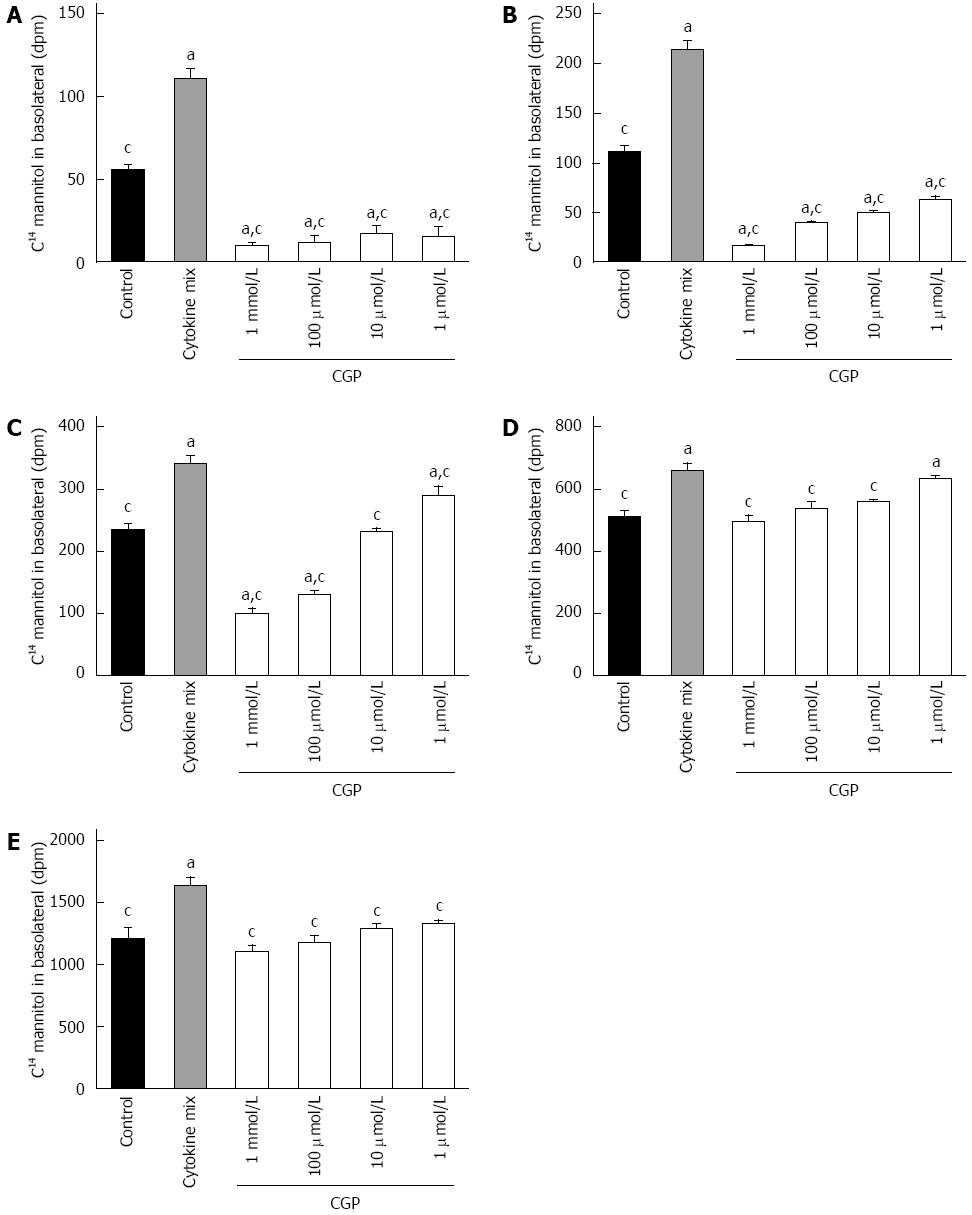
Figure 6 Effect of cytokines on mannitol flux in the presence of calcium glycerophosphate.
Cytokine treatment stimulated transepithelial mannitol flux, an effect that was attenuated by calcium glycerophosphate (CGP) in a concentration dependent fashion. Each treatment represents the mean of three independent experiments. Data were analyzed by two-way analysis of variance, followed by Tukey’s test for multiple comparisons. aP < 0.05 vs control; cP < 0.05 vs cytokine alone. A: 2 h; B: 4 h; C: 6 h; D: 8 h; E: 24 h.
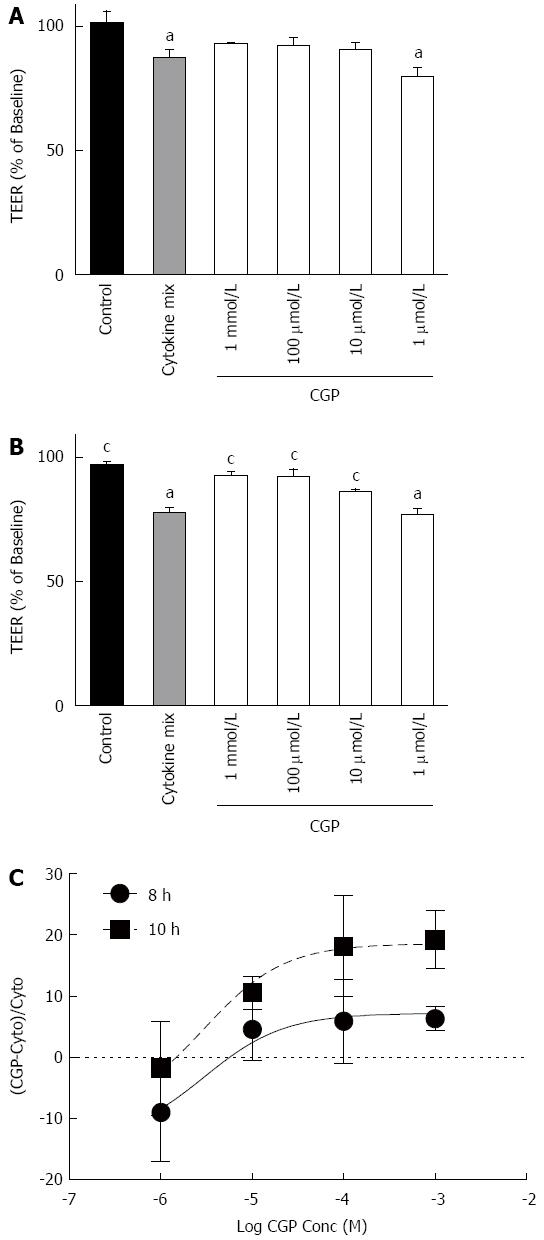
Figure 7 Effect of calcium glycerophosphate on trans epithelial electric resistance during cytomix treatment.
Data were analyzed by two way analysis of variance, followed by Tukey’s test for multiple comparisions. Each treatment represents the mean of three independent experiments. aP < 0.05 vs control; cP < 0.05 vs cytomix alone. A: 8 h; B: 10 h; C: Representative graph. CGP: Calcium glycerophosphate; TEER: Trans epithelial electric resistance.
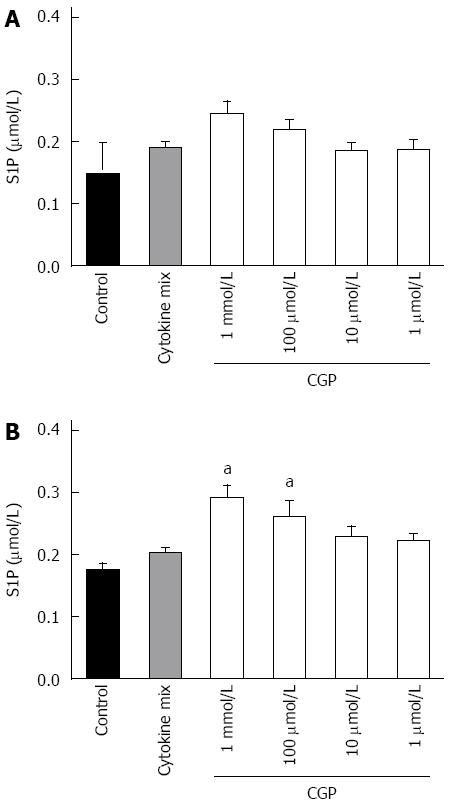
Figure 8 Effect of calcium glycerophosphate on sphingosine 1 phosphate concentrations in the presence of cytomix.
Each treatment represents the mean of three independent experiments. Data were analyzed by two way analysis of variance, followed by Tukey’s test for multiple comparisons. aP <0.05, vs control. A: 2 h; B: 4 h. CGP: Calcium glycerophosphate; TEER: Trans epithelial electric resistance.
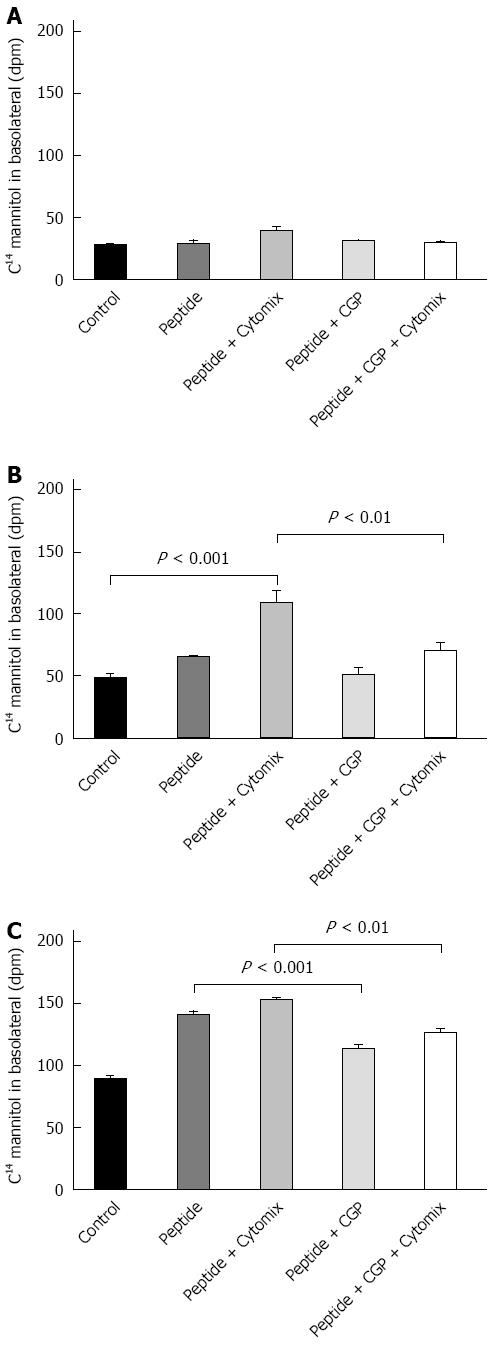
Figure 9 Effect of 1 mmol/L calcium glycerophosphate on α-gliadin peptide fragment 31-55 induced mannitol flux.
Each treatment represents the mean of three independent experiments. A: 1 h; B: 2 h; C: 4 h. CGP: Calcium glycerophosphate.
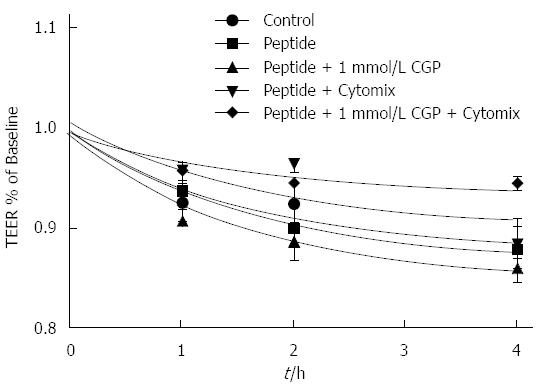
Figure 10 Effect of 1 mmol/L calcium glycerophosphate on α-gliadin peptide induced reduction in trans epithelial electric resistance.
CGP: Calcium glycerophosphate; TEER: Transepithelial electrical resistance.
- Citation: Datta P, Weis MT. Calcium glycerophosphate preserves transepithelial integrity in the Caco-2 model of intestinal transport. World J Gastroenterol 2015; 21(30): 9055-9066
- URL: https://www.wjgnet.com/1007-9327/full/v21/i30/9055.htm
- DOI: https://dx.doi.org/10.3748/wjg.v21.i30.9055


