Copyright
©The Author(s) 2015.
World J Gastroenterol. Aug 7, 2015; 21(29): 8878-8887
Published online Aug 7, 2015. doi: 10.3748/wjg.v21.i29.8878
Published online Aug 7, 2015. doi: 10.3748/wjg.v21.i29.8878
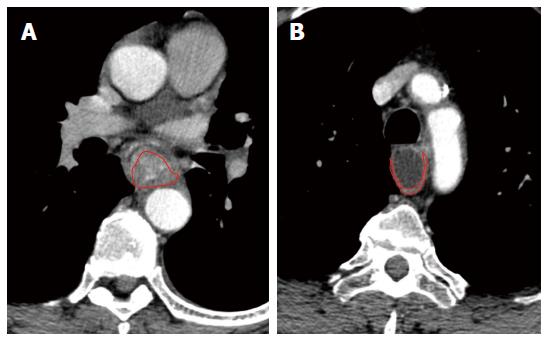
Figure 1 Visualization of reliable region of interest.
A: Regions of interest (circled red) for esophageal stenosis were drawn freehand around the thickened walls; B: Regions of interest (circled red) for the background intact esophagus were drawn around the intact esophageal wall.
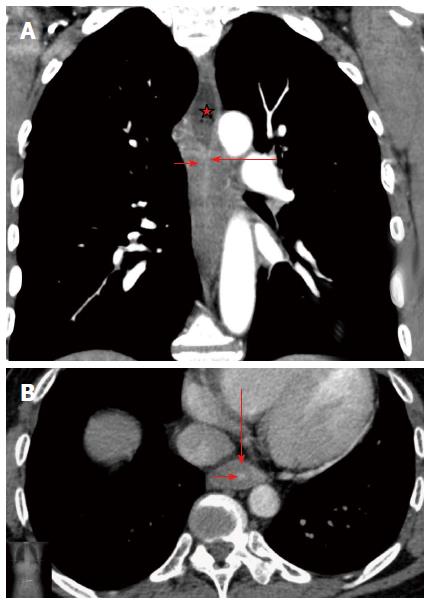
Figure 2 Corrosive esophageal stricture.
A: Multidetector computed tomography (MDCT). Arterial phase. Coronal reconstruction. Concentric esophageal wall thickening of the corrosive stricture, which has a homogeneous structure (short arrow). The mucosa is traceable as a thin hyperintense line in the centre of thickened walls that was caused by fibrotic changes (long arrow). Conically shaped suprastenotic dilatation (star) with smooth upper boundaries of the stricture; B: MDCT. Arterial phase. Axial CT scan. Target sign - thickening of saved esophageal mucosa (short arrow) in the centre of fibrotically changed submucosal, muscular layers and adventitia of esophageal walls (long arrow).
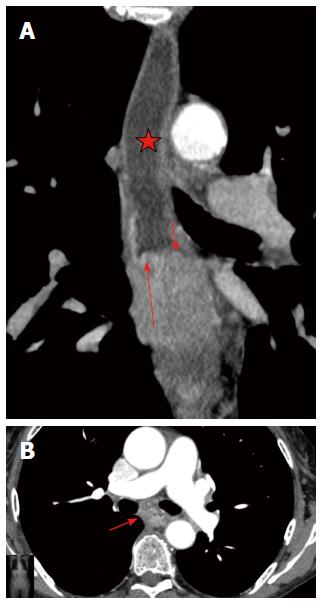
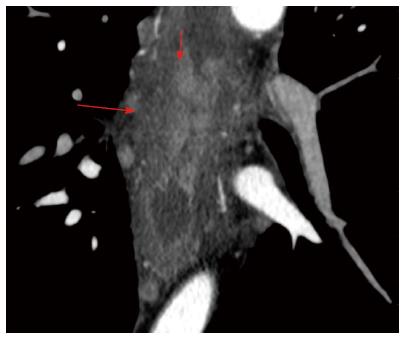
Figure 3 Esophageal cancer.
A: Multidetector computed tomography (MDCT). Arterial phase. Coronal reconstruction of esophageal cancer. Tuberous upper and lower boundaries of stenosis (short arrow); rupture of the mucous membrane at the upper boundary of stenosis (long arrow); cup-shaped suprastenotic dilatation (star); B: MDCT. Arterial phase. Axial CT scan of esophageal cancer. Eccentric esophageal wall thickening without mucous membrane visualization in stenosis (arrow).
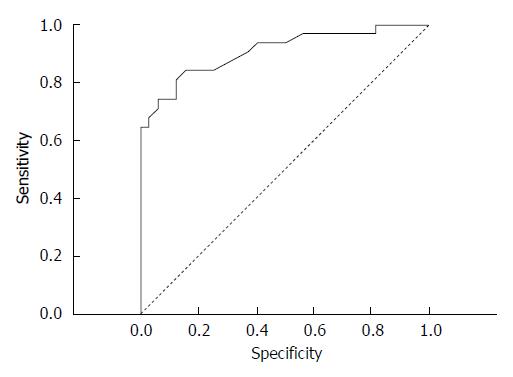
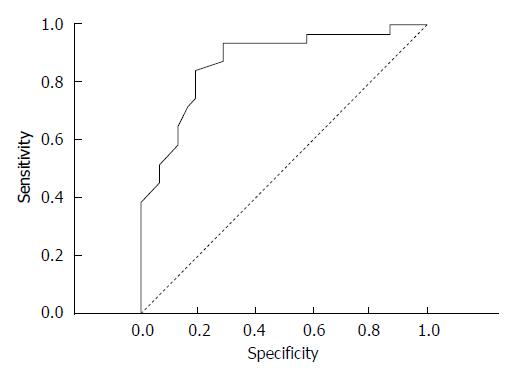
Figure 4 Receiver operating characteristic curve of ΔCT in arterial phase.
A criterion of 11.5 HU in arterial phase showed optimal sensitivity (83.87%) and a specificity of 84.85% for the diagnosis of esophageal cancer.
Figure 5 Receiver operating characteristic curve of ΔCT in delayed phase.
A criterion of 18.5 HU showed optimal sensitivity (93.75%) and a specificity of 70.96% for the diagnosis of a benign esophageal stricture.
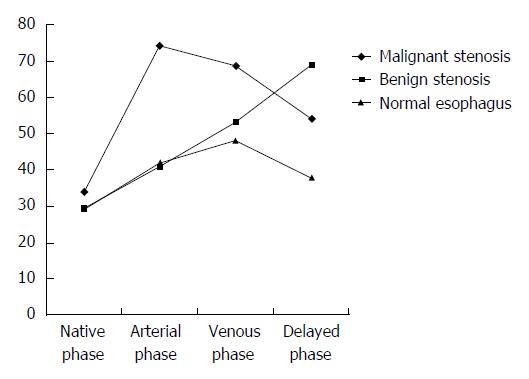
Figure 6 Graphs of mean attenuation.
Graph of mean attenuation of normal esophageal wall, tumor and benign stenosis.
Figure 7 Atypical manifestation of corrosive esophageal stricture at computed tomography imaging.
Arterial phase. Axial computed tomography (CT) scan of corrosive esophageal stricture. Development of mucosa granulations (short arrow), fibrotically changed submucosal and muscular layers and adventitia of esophageal walls (long arrow).
- Citation: Karmazanovsky GG, Buryakina SA, Kondratiev EV, Yang Q, Ruchkin DV, Kalinin DV. Value of two-phase dynamic multidetector computed tomography in differential diagnosis of post-inflammatory strictures from esophageal cancer. World J Gastroenterol 2015; 21(29): 8878-8887
- URL: https://www.wjgnet.com/1007-9327/full/v21/i29/8878.htm
- DOI: https://dx.doi.org/10.3748/wjg.v21.i29.8878


