Copyright
©The Author(s) 2015.
World J Gastroenterol. Jun 21, 2015; 21(23): 7254-7263
Published online Jun 21, 2015. doi: 10.3748/wjg.v21.i23.7254
Published online Jun 21, 2015. doi: 10.3748/wjg.v21.i23.7254
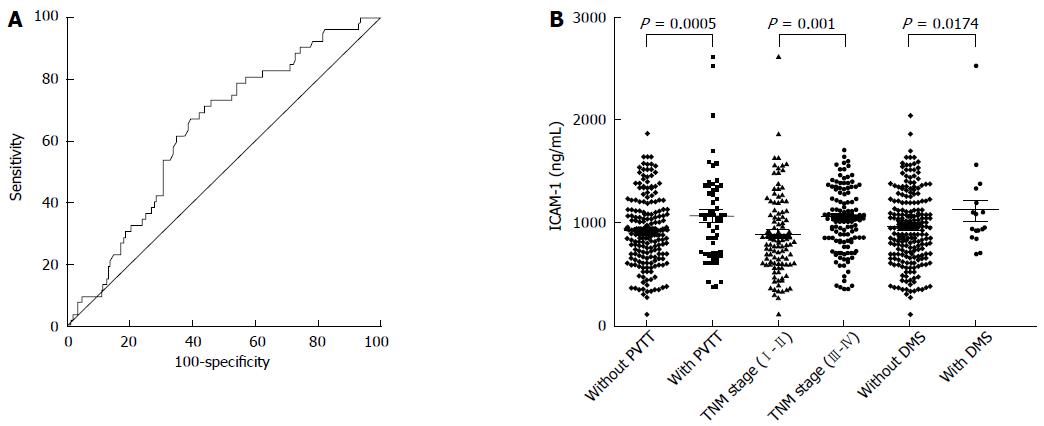
Figure 1 Receiver operating characteristic curve and serum level of intercellular adhesion molecule-1 in different hepatocellular carcinoma subgroups.
A: Receiver operating characteristic curves to assess hepatocellular carcinoma (HCC) patients with prognosis by the appropriate cutoff values of preoperative intercellular adhesion molecule-1 (ICAM-1); B: Two hundred and thirty-six cases of HCC patients were stratified according to portal vein tumor thrombus (PVTT), tumor-node-metastasis (TNM) stage and distant metastasis (DMS), comparing the serum level of ICAM-1 in each subgroup. The percentage of high ICAM-1 patients with PVTT, TNM stage III-IV and with DMS are much higher than those without PVTT, TNM stage I-II and without DMS, respectively (P < 0.05).
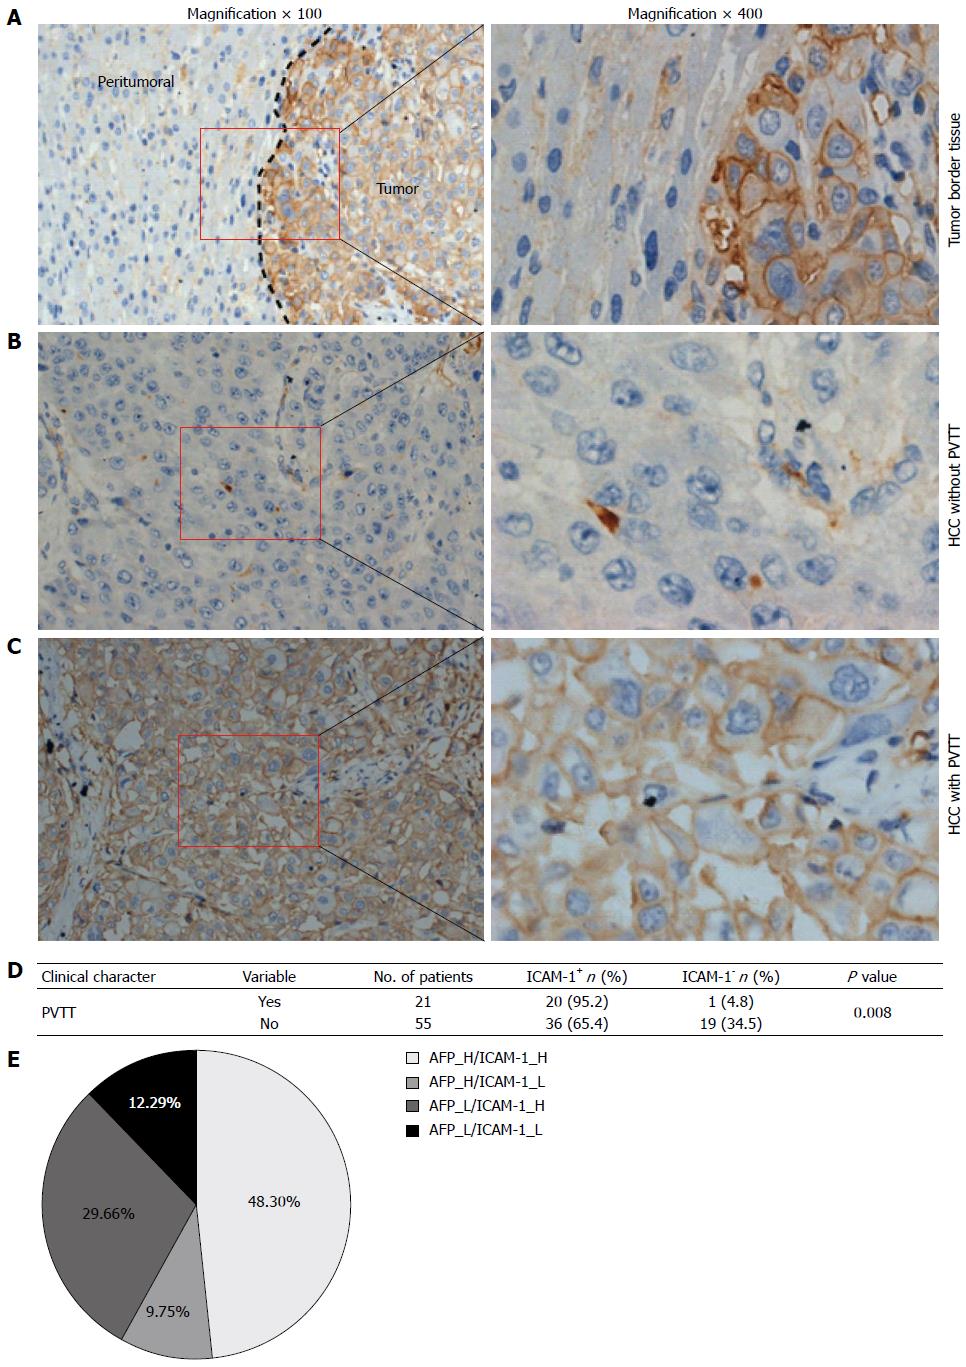
Figure 2 Level of intercellular adhesion molecule-1 in hepatocellular carcinoma specimens.
A-C: Intercellular adhesion molecule-1 (ICAM-1) expression in hepatocellular carcinoma (HCC) was confirmed by immunohistochemical staining (n = 76). Representative pictures are shown, the nuclei were counterstained with hematoxylin, original magnification: left (× 100) and right side (× 400). A: Tumor border tissue of representative intratumoral high density staining (right) and peritumoral low density staining (left) of ICAM-1 are shown. The dark dotted line represents the interface of the tumor and adjacent liver tissues; B and C: Representative HCC tissues without portal vein tumor thrombus (PVTT) low density staining (B) and with PVTT high density staining (C) of ICAM-1 are shown, respectively; D: Statistical analysis was performed using the chi-square test to compare the relative levels of ICAM-1 negative (ICAM-1-) or positive (ICAM-1+) between HCC with PVTT and HCC without PVTT (P = 0.008); E: Combined measurement of serum ICAM-1 and alpha-fetoprotein (AFP). The distribution of the ICAM-1 and AFP levels in the HCC specimens. The numbers indicate the percentages of ICAM-1 and/or AFP higher (H) or lower (L) HCC specimens.
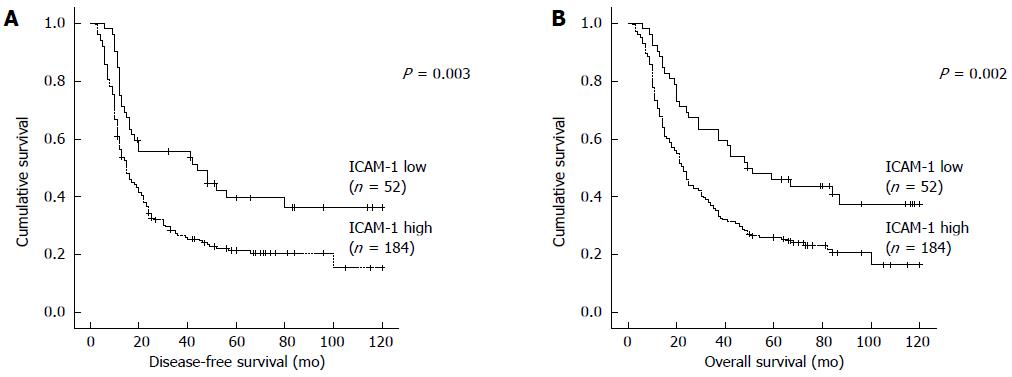
Figure 3 Relationship between intercellular adhesion molecule-1 level and disease-free survival or overall survival.
Patients with high intercellular adhesion molecule-1 (ICAM-1) level had a shorter disease-free survival (DFS) (A) and overall survival (OS) (B). The solid line represents the patients with low ICAM-1 level, whereas the dashed line represents the patients with high ICAM-1 level.
- Citation: Zhu PP, Yuan SG, Liao Y, Qin LL, Liao WJ. High level of intercellular adhesion molecule-1 affects prognosis of patients with hepatocellular carcinoma. World J Gastroenterol 2015; 21(23): 7254-7263
- URL: https://www.wjgnet.com/1007-9327/full/v21/i23/7254.htm
- DOI: https://dx.doi.org/10.3748/wjg.v21.i23.7254


