Copyright
©The Author(s) 2015.
World J Gastroenterol. May 28, 2015; 21(20): 6374-6380
Published online May 28, 2015. doi: 10.3748/wjg.v21.i20.6374
Published online May 28, 2015. doi: 10.3748/wjg.v21.i20.6374
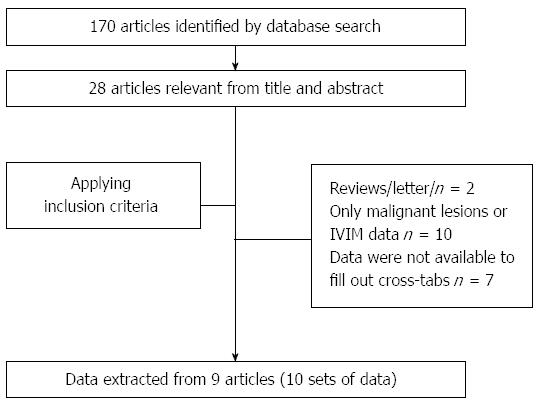
Figure 1 Selection process of the articles.
Pooled analysis.
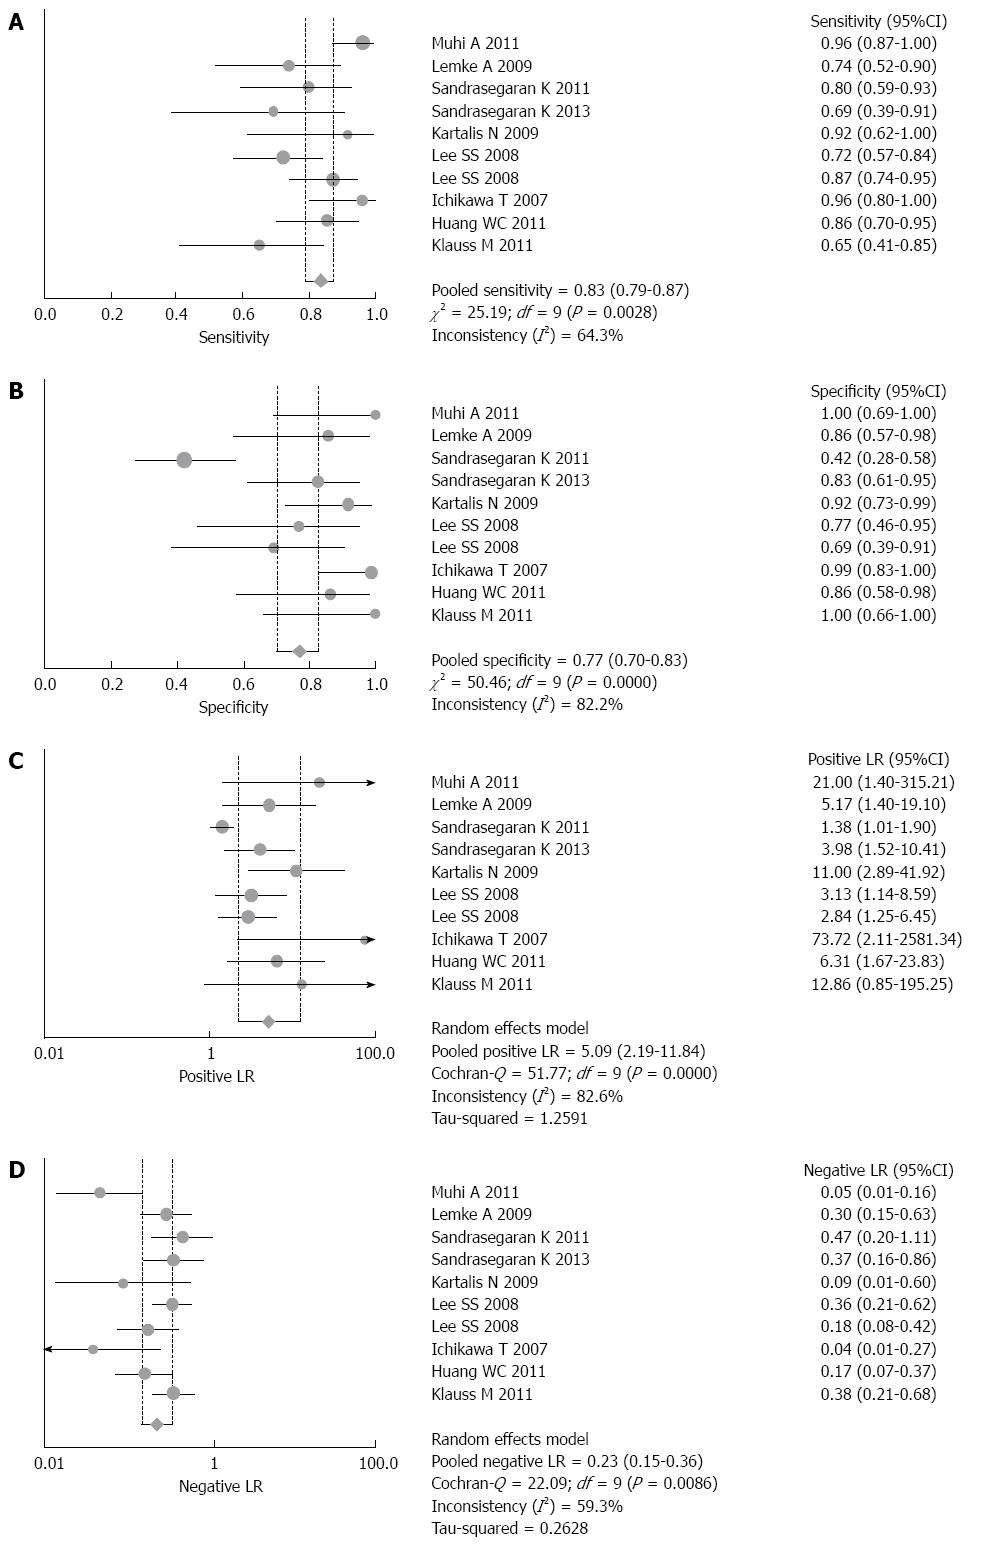
Figure 2 Forest plot of sensitivity (A), specificity (B), positive likelihood ratio (C) and negative likelihood ratio (D) with corresponding 95%CI of nine studies (10 sets of data).
The random-effects model was used. The pooled sensitivity and specificity of DWI were 0.83 (95%CI: 0.79-0.87) and 0.77 (95%CI: 0.70-0.83), respectively. Positive likelihood ratio (PLR) and negative likelihood ratio (NLR) were 5.09 (95%CI: 2.19-11.84) and 0.23 (95%CI: 0.15-0.36), respectively.
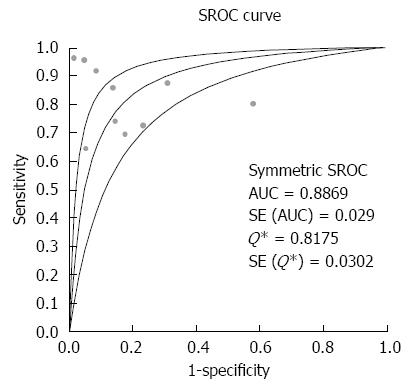
Figure 3 Summary receiver operating characteristic curve.
Sensitivity and specificity are plotted in the receiver operating characteristic space for individual studies. The AUC and Q* index were 0.89 and 0.82, respectively, indicating good diagnostic accuracy. SROC: Summary receiver operating characteristic.
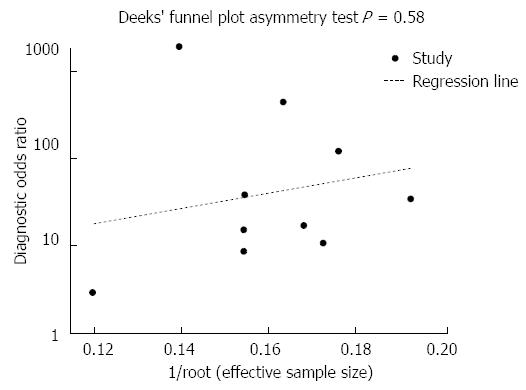
Figure 4 Publication bias was not present (t = 0.
58, P = 0.577).
- Citation: Hong BZ, Li XF, Lin JQ. Differential diagnosis of pancreatic cancer by single-shot echo-planar imaging diffusion-weighted imaging. World J Gastroenterol 2015; 21(20): 6374-6380
- URL: https://www.wjgnet.com/1007-9327/full/v21/i20/6374.htm
- DOI: https://dx.doi.org/10.3748/wjg.v21.i20.6374


