Copyright
©The Author(s) 2015.
World J Gastroenterol. May 28, 2015; 21(20): 6341-6351
Published online May 28, 2015. doi: 10.3748/wjg.v21.i20.6341
Published online May 28, 2015. doi: 10.3748/wjg.v21.i20.6341
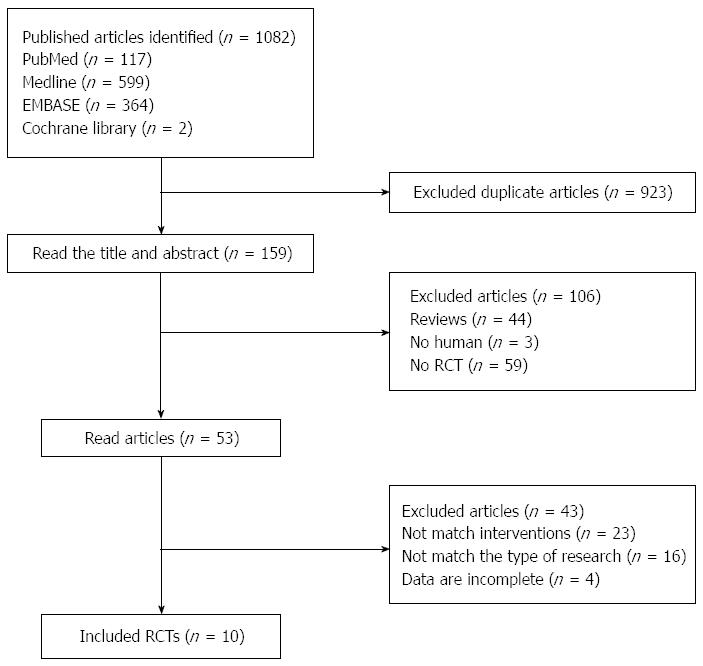
Figure 1 Flow chart of study selection.
RCTs: Randomized controlled trials.
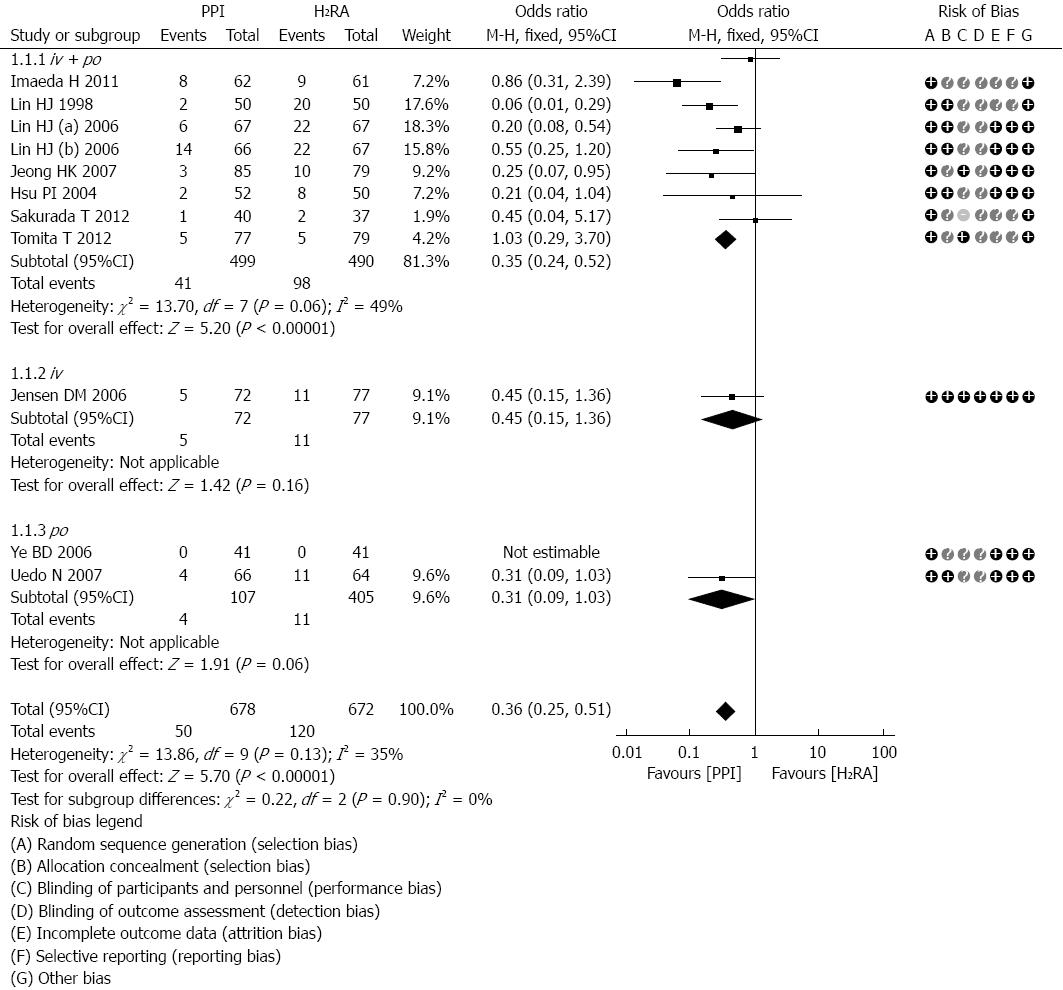
Figure 2 Forest plot and risk of bias summary from the Cochrane risk of bias tool comparing proton pump inhibitors therapy vs H2 receptor antagonists therapy efficacy for the recurrent bleeding rate.
PPI: Proton pump inhibitors; H2R: H2 receptor antagonists.
Figure 3 Forest plot comparing the efficacy of proton pump inhibitors therapy vs H2 receptor antagonists therapy for the recurrent bleeding rate mortality.
PPI: Proton pump inhibitors; H2R: H2 receptor antagonists.
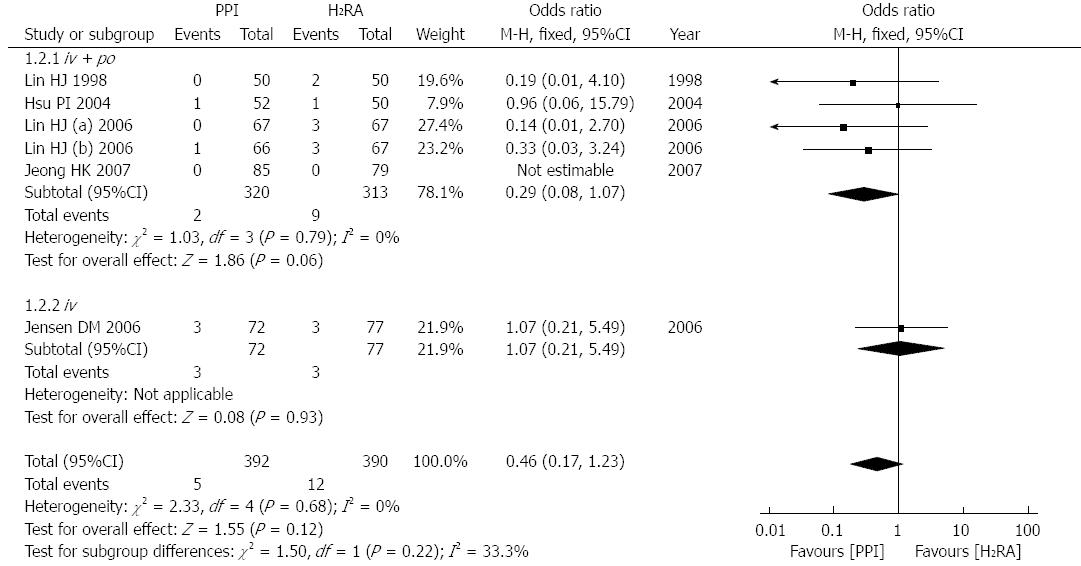
Figure 4 Forest plot comparing the efficacy of proton pump inhibitors therapy vs H2 receptor antagonists therapy for the required surgery rate.
PPI: Proton pump inhibitors; H2R: H2 receptor antagonists.
Figure 5 Forest plot comparing the efficacy of proton pump inhibitors therapy vs H2 receptor antagonists therapy for blood transfusion units.
PPI: Proton pump inhibitors; H2R: H2 receptor antagonists.
Figure 6 Forest plot comparing the efficacy of proton pump inhibitors therapy vs H2 receptor antagonists therapy for hospitalization time.
PPI: Proton pump inhibitors; H2R: H2 receptor antagonists.
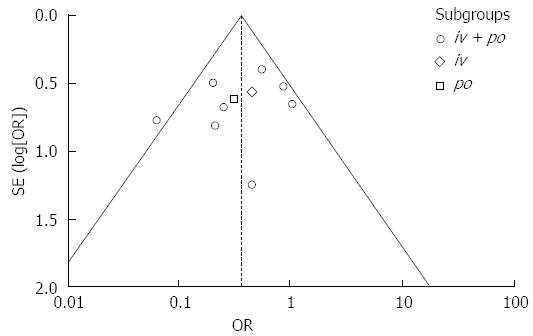
Figure 7 Funnel plot evaluating the publication bias for recurrent bleeding rate.
-
Citation: Zhang YS, Li Q, He BS, Liu R, Li ZJ. Proton pump inhibitors therapy
vs H2 receptor antagonists therapy for upper gastrointestinal bleeding after endoscopy: A meta-analysis. World J Gastroenterol 2015; 21(20): 6341-6351 - URL: https://www.wjgnet.com/1007-9327/full/v21/i20/6341.htm
- DOI: https://dx.doi.org/10.3748/wjg.v21.i20.6341


