Copyright
©The Author(s) 2015.
World J Gastroenterol. May 28, 2015; 21(20): 6329-6340
Published online May 28, 2015. doi: 10.3748/wjg.v21.i20.6329
Published online May 28, 2015. doi: 10.3748/wjg.v21.i20.6329
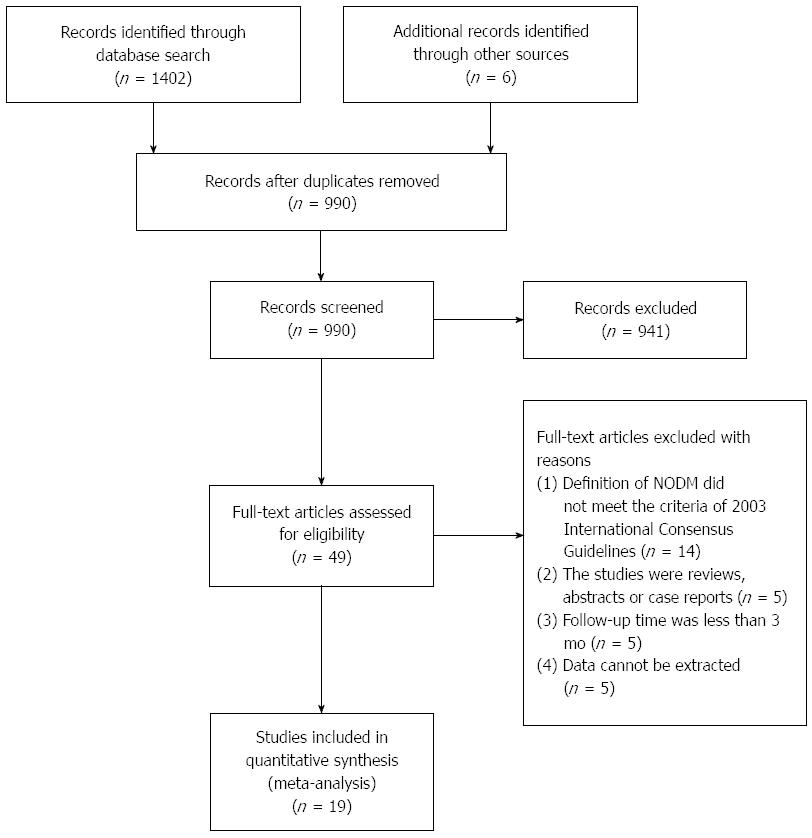
Figure 1 Flow diagram of the study selection.
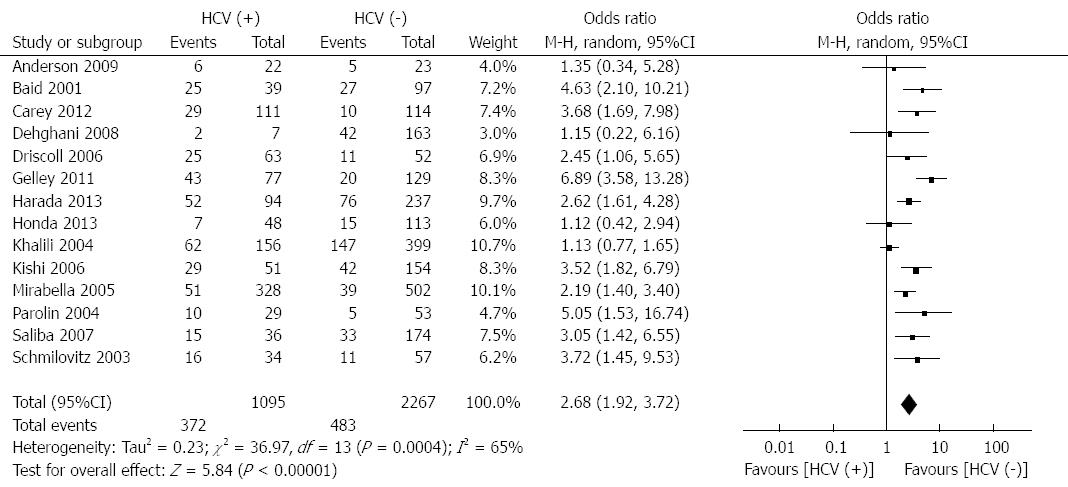
Figure 2 Forest plot of studies finding an association between hepatitis C virus infection and new onset diabetes mellitus.
There was significant heterogeneity in the results of the meta-analysis. The pooled OR (OR = 2.68; 95%CI: 1.92-3.72) indicated a significant association between hepatitis C virus infection and the risk of new-onset diabetes mellitus after liver transplantation.
Figure 3 Forest plot of studies finding an association between hepatitis B virus infection and new onset diabetes mellitus.
There was significant heterogeneity in the results of the meta-analysis. The pooled OR (OR = 1.04; 95%CI: 0.54-2.00) indicated a significant association between hepatitis B virus infection and the risk of new-onset diabetes mellitus after liver transplantation.
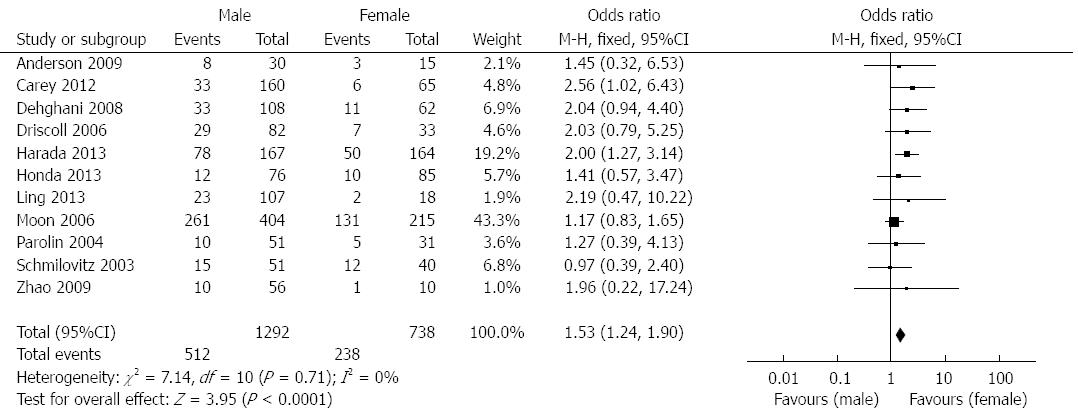
Figure 4 Forest plot of studies finding an association between gender and new onset diabetes mellitus.
There was no significant heterogeneity in the results of the meta-analysis. The pooled OR (OR = 1.53; 95%CI: 1.24-1.90) indicated a significant association between male gender and the risk of new-onset diabetes mellitus after liver transplantation.
Figure 5 Forest plot of studies finding an association between impaired fasting glucose and new-onset diabetes mellitus.
There was no heterogeneity in the results of the meta-analysis. The pooled OR (OR = 3.27; 95%CI: 1.84-5.81) indicated a significant association between pre-transplant impaired fasting glucose and the risk of new-onset diabetes mellitus after liver transplantation.
Figure 6 Forest plot of studies finding an association between a family history of diabetes and new-onset diabetes mellitus.
There was no significant heterogeneity in the results of the meta-analysis. The pooled OR (OR = 1.69; 95%CI: 1.09-2.63) indicated a significant association between a family history of diabetes and the risk of new-onset diabetes mellitus after liver transplantation.
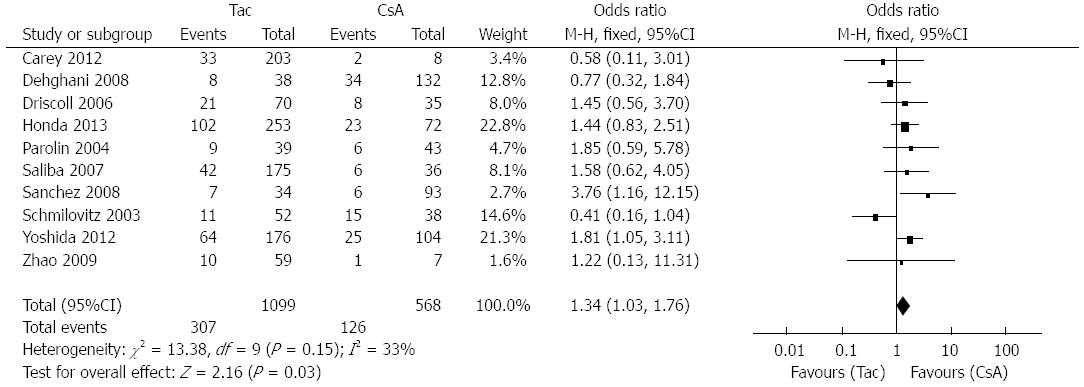
Figure 7 Forest plot of studies finding an association between immunosuppression and new-onset diabetes mellitus.
There was no significant heterogeneity in the results of the meta-analysis. The pooled OR (OR = 1.34; 95%CI: 1.03-1.76) indicated a significant association between tacrolimus and the risk of new-onset diabetes mellitus after liver transplantation.
Figure 8 Forest plot of studies finding an association between alcohol-related cirrhosis and new-onset diabetes mellitus.
There was no significant heterogeneity in the results of the meta-analysis. The pooled OR (OR = 0.71; 95%CI: 0.36-1.37) indicated no significant association between alcohol-related cirrhosis and the risk of new-onset diabetes mellitus after liver transplantation.
Figure 9 Forest plot of studies finding an association between body mass index and new-onset diabetes mellitus.
There was no significant heterogeneity in the results of the meta-analysis. The WMD (WMD = 1.19, 95%CI: 0.69-1.68) indicated a significant association between body mass index and the risk of new-onset diabetes mellitus after liver transplantation.
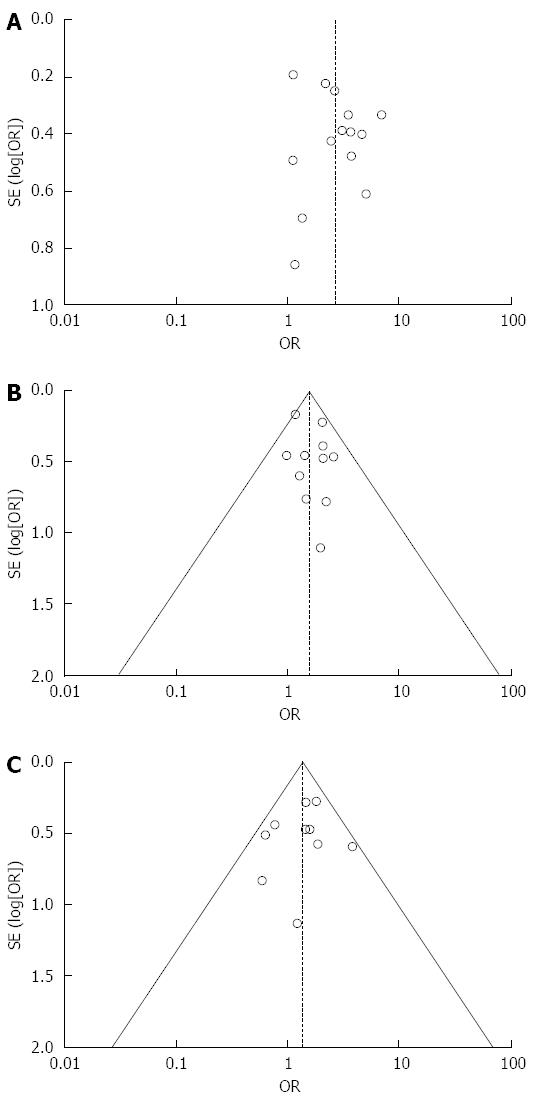
Figure 10 Funnel plots of studies conducted on new-onset diabetes mellitus and the risk factors of hepatitis C virus infection (A), gender (B) and immunosuppression (C).
- Citation: Li DW, Lu TF, Hua XW, Dai HJ, Cui XL, Zhang JJ, Xia Q. Risk factors for new onset diabetes mellitus after liver transplantation: A meta-analysis. World J Gastroenterol 2015; 21(20): 6329-6340
- URL: https://www.wjgnet.com/1007-9327/full/v21/i20/6329.htm
- DOI: https://dx.doi.org/10.3748/wjg.v21.i20.6329


