Copyright
©The Author(s) 2015.
World J Gastroenterol. May 7, 2015; 21(17): 5303-5310
Published online May 7, 2015. doi: 10.3748/wjg.v21.i17.5303
Published online May 7, 2015. doi: 10.3748/wjg.v21.i17.5303
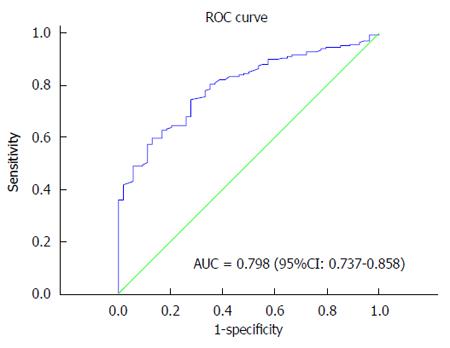
Figure 1 Receiver operating characteristic curve analysis to predict the gallbladder cancer stage.
Each point on the receiver operating characteristic (ROC) curve corresponds to a value of platelet count (PLT). A diagonal line at 45°, known as the line of chance, would result from a test that allocated subjects randomly. In general, a good cutoff point produces high sensitivity and high specificity, which could be interpreted as selecting the point on the ROC curve with the largest vertical distance from the line of chance. The area under the ROC curve (AUC) indicates the diagnostic power of PLT. An ROC curve for survival prediction was plotted to verify the optimum cutoff point for PLT, which was 178 × 109/L. The AUC for PLT was 79.8% (95%CI: 0.737-0.858), with a sensitivity of 74.6% and a specificity of 72.2% by the Youden index.
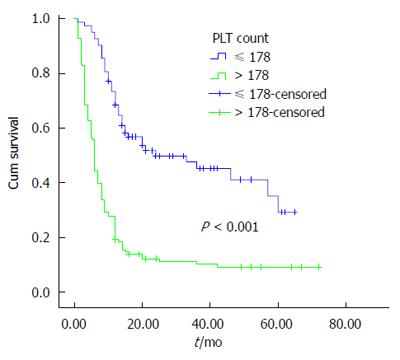
Figure 2 Survival curve according to the presence of platelet count.
The patients with a platelet count (PLT) ≤ 178 had a significantly better overall survival than those with a PLT > 178 (P < 0.001).
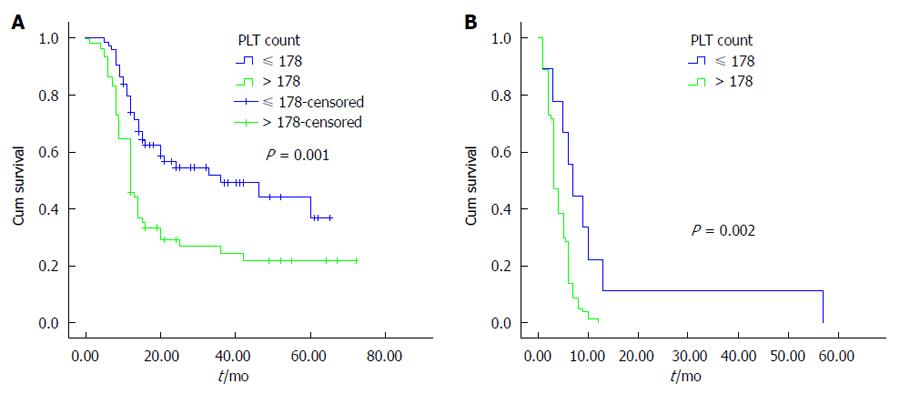
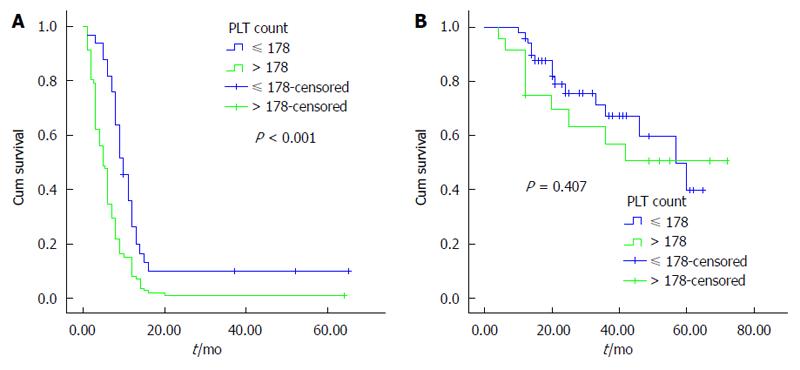
Figure 3 Kaplan-Meier survival curves stratified by platelet count in the gallbladder cancer patients with a tumor located in the neck of the gallbladder (A) and located in other locations (body, bottom) of the gallbladder (B).
PLT: Platelet count.
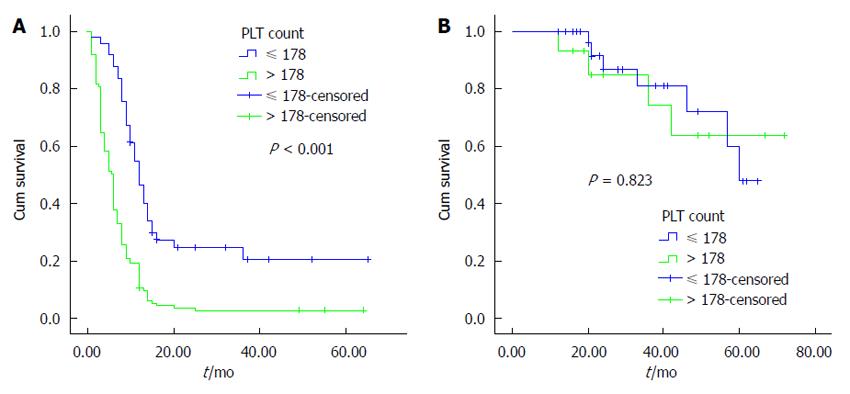
Figure 4 Kaplan-Meier survival curves stratified by platelet count in the pTNM 0-II stage (A) and III-IV stage (B) gallbladder cancer patients.
PLT: Platelet count.
Figure 5 Kaplan-Meier survival curves stratified by platelet count in gallbladder cancer patients with lymph node metastasis (A) and in those without (B).
PLT: Platelet count.
- Citation: Wang RT, Zhang LQ, Mu YP, Li JB, Xu XS, Pang Q, Sun LK, Zhang X, Dong SB, Wang L, Liu C. Prognostic significance of preoperative platelet count in patients with gallbladder cancer. World J Gastroenterol 2015; 21(17): 5303-5310
- URL: https://www.wjgnet.com/1007-9327/full/v21/i17/5303.htm
- DOI: https://dx.doi.org/10.3748/wjg.v21.i17.5303


