Copyright
©The Author(s) 2015.
World J Gastroenterol. Apr 21, 2015; 21(15): 4744-4749
Published online Apr 21, 2015. doi: 10.3748/wjg.v21.i15.4744
Published online Apr 21, 2015. doi: 10.3748/wjg.v21.i15.4744
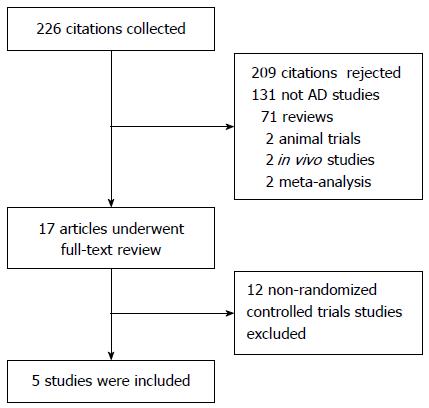
Figure 1 Flow diagram of the studies identified.
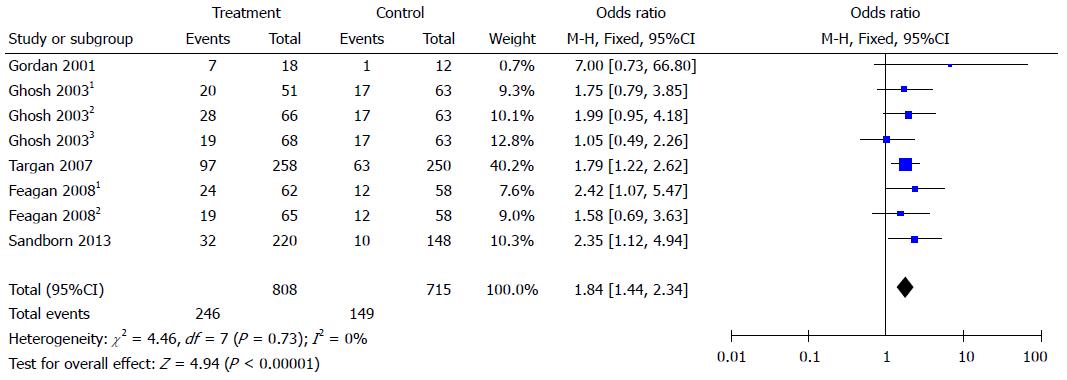
Figure 2 Forest plots of clinical response.
Clinical response was defined as a decrement of ≥ 70 points in CDAI score from baseline (week 0). Ghosh 20031: 6 mg/kg natalizumab at 0 and 4 wk; Ghosh 20032: 3 mg/kg natalizumab at 0 and 4 wk; Ghosh 20033: 3 mg/kg natalizumab at 0 wk. Feagan 20081: 2 mg/kg vedolizumab at 0 and 4 wk; Feagan 20082: 0.5 mg/kg vedolizumab at 0 and 4 wk.
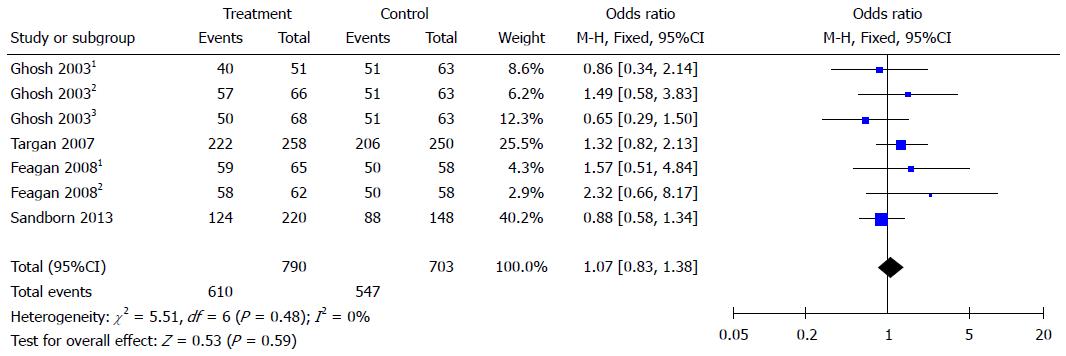
Figure 3 Forest plots of clinical remission.
Clinical remission was defined as CDAI score < 150. Ghosh 20031: 6 mg/kg natalizumab at 0 and 4 wk; Ghosh 20032: 3 mg/kg natalizumab at 0 and 4 wk; Ghosh 20033: 3 mg/kg natalizumab at 0 wk. Feagan 20081: 2 mg/kg vedolizumab at 0 and 4 wk; Feagan 20082: 0.5 mg/kg vedolizumab at 0 and 4 wk.
Figure 4 Forest plots of common adverse reactions.
Ghosh 20031: 6 mg/kg natalizumab at 0 and 4 wk; Ghosh 20032: 3 mg/kg natalizumab at 0 and 4 wk; Ghosh 20033: 3 mg/kg natalizumab at 0 wk. Feagan 20081: 2 mg/kg vedolizumab at 0 and 4 wk; Feagan 20082: 0.5 mg/kg vedolizumab at 0 and 4 wk.
Figure 5 Forest plots of serious adverse reactions.
Ghosh 20031: 6 mg/kg natalizumab at 0 and 4 wk; Ghosh 20032: 3 mg/kg natalizumab at 0 and 4 wk; Ghosh 20033: 3 mg/kg natalizumab at 0 wk. Feagan 20081: 2 mg/kg vedolizumab at 0 and 4 wk; Feagan 20082: 0.5 mg/kg vedolizumab at 0 and 4 wk.
- Citation: Ge WS, Fan JG. Integrin antagonists are effective and safe for Crohn’s disease: A meta-analysis. World J Gastroenterol 2015; 21(15): 4744-4749
- URL: https://www.wjgnet.com/1007-9327/full/v21/i15/4744.htm
- DOI: https://dx.doi.org/10.3748/wjg.v21.i15.4744


