Copyright
©The Author(s) 2015.
World J Gastroenterol. Apr 21, 2015; 21(15): 4526-4535
Published online Apr 21, 2015. doi: 10.3748/wjg.v21.i15.4526
Published online Apr 21, 2015. doi: 10.3748/wjg.v21.i15.4526
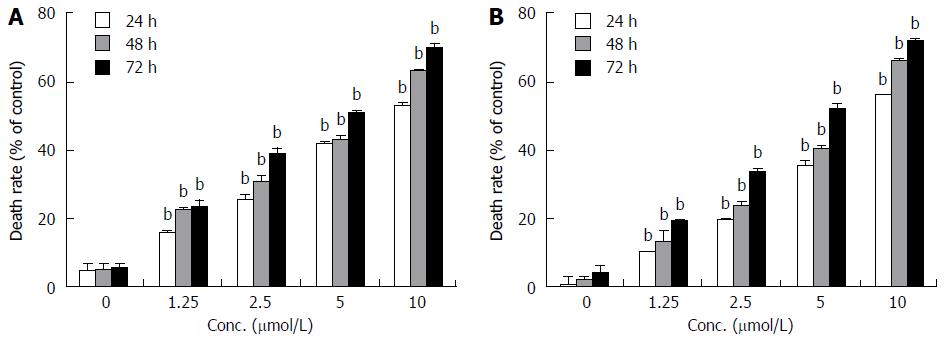
Figure 1 Effect of alternol on viability of pancreatic cancer cells.
PANC-1 (A) and BxPC3 cells (B) at 7 × 10⁵ cells/well are cultured with alternol (0, 1.25, 2.5, 5 and 10 μmol/L) for 24, 48 and 72 h in RPMI 1640/10% FBS. Cell viability was determined daily by cell counting. Each point represents the mean of three independent experiments. bP < 0.01 vs controls.
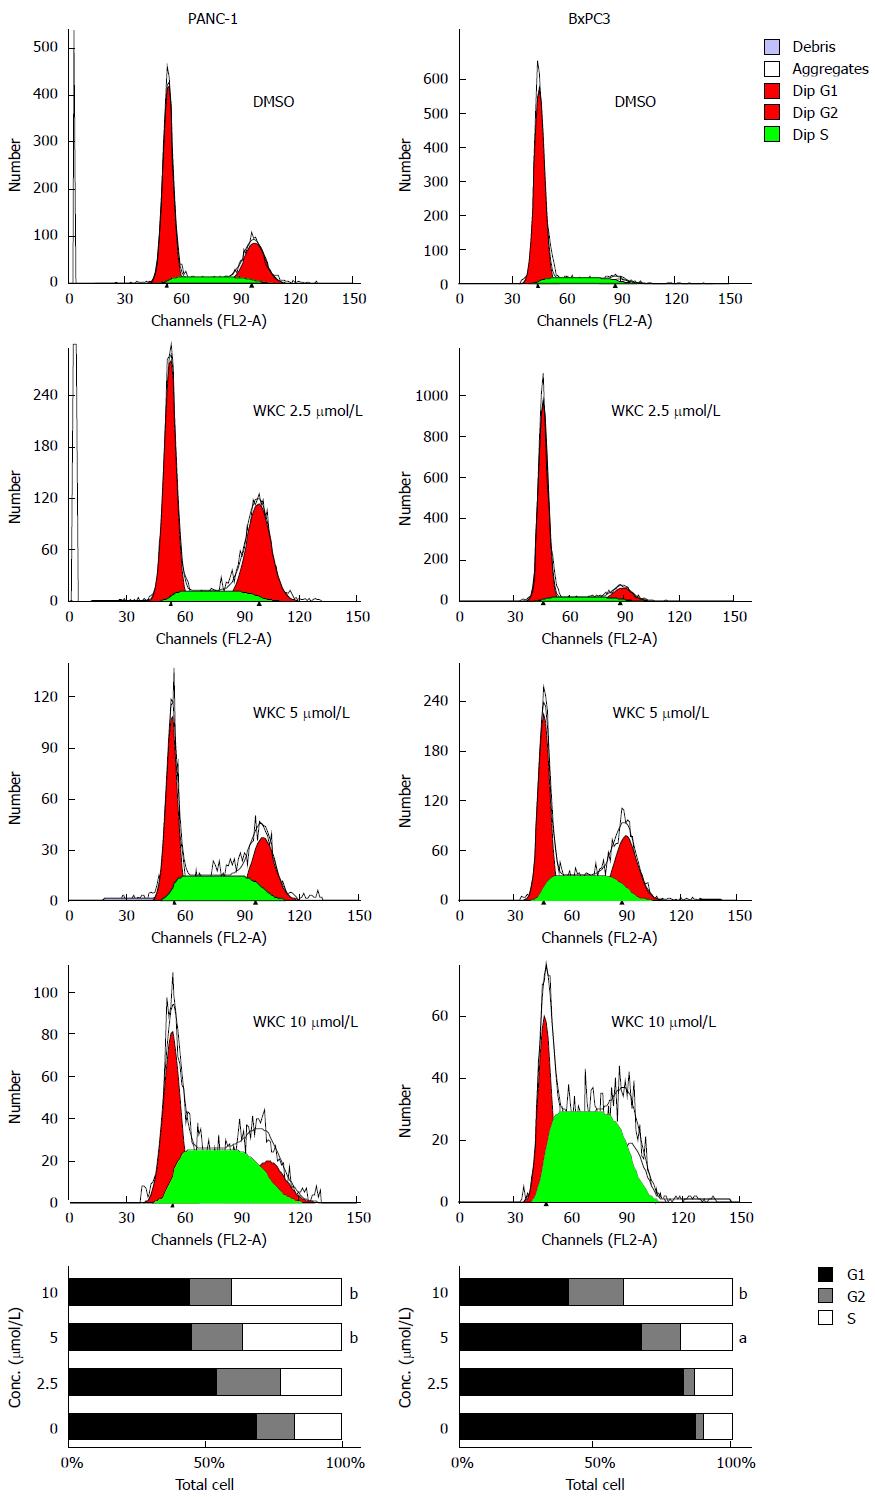
Figure 2 Effect of alternol on cell-cycle distribution.
PANC-1 and BxPC3 cells (7 × 10⁵) were treated with 0, 2.5, 5 and 10 μmol/Lof alternol and analyzed at 24 h by flow cytometry. The data are representative of three independent experiments. aP < 0.05, bP < 0.01 vs controls.
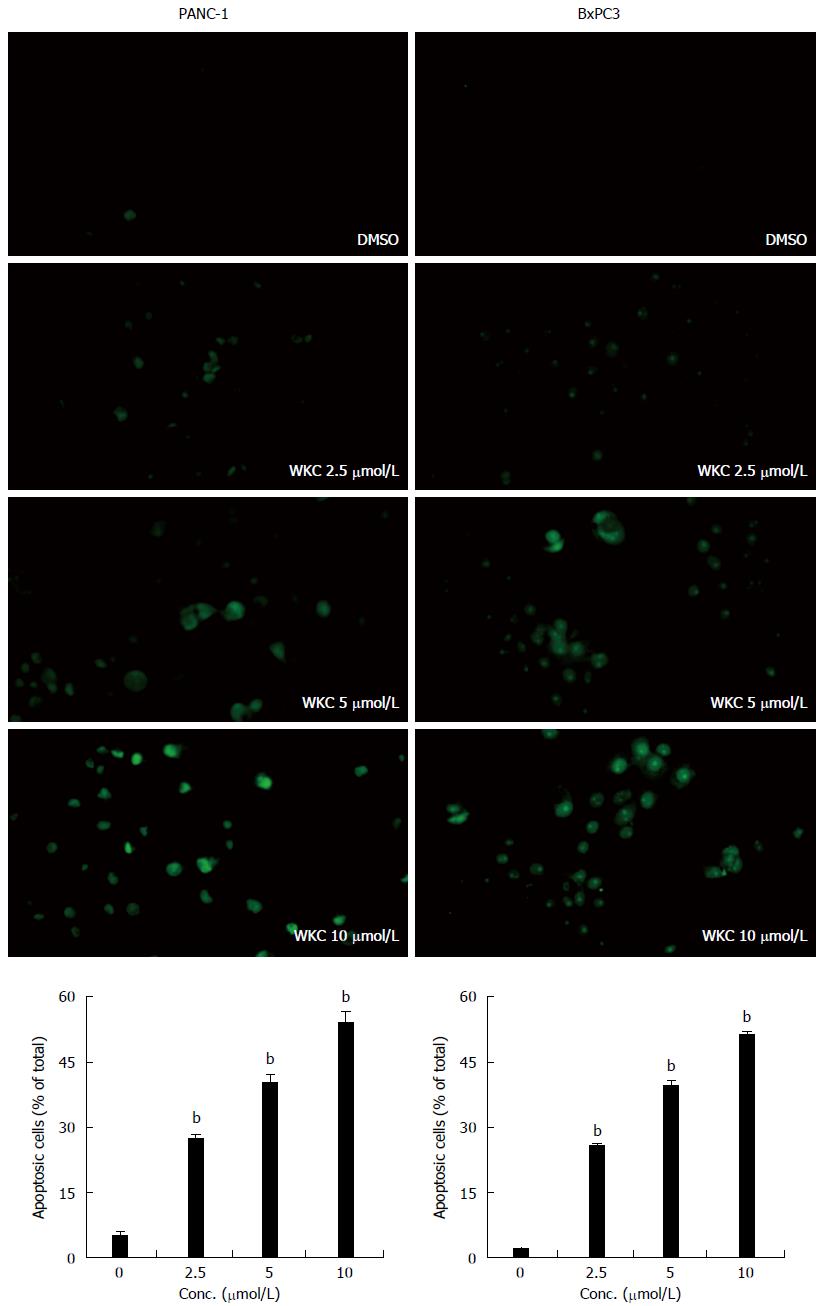
Figure 3 Apoptosis measured by TUNEL assay.
PANC-1 and BxPC cells were treated with 0, 2.5, 5 and 10 μmol/L alternol for 24 h and stained with TUNEL. The pictures are representative of three independent experiments. bP < 0.01 vs controls.
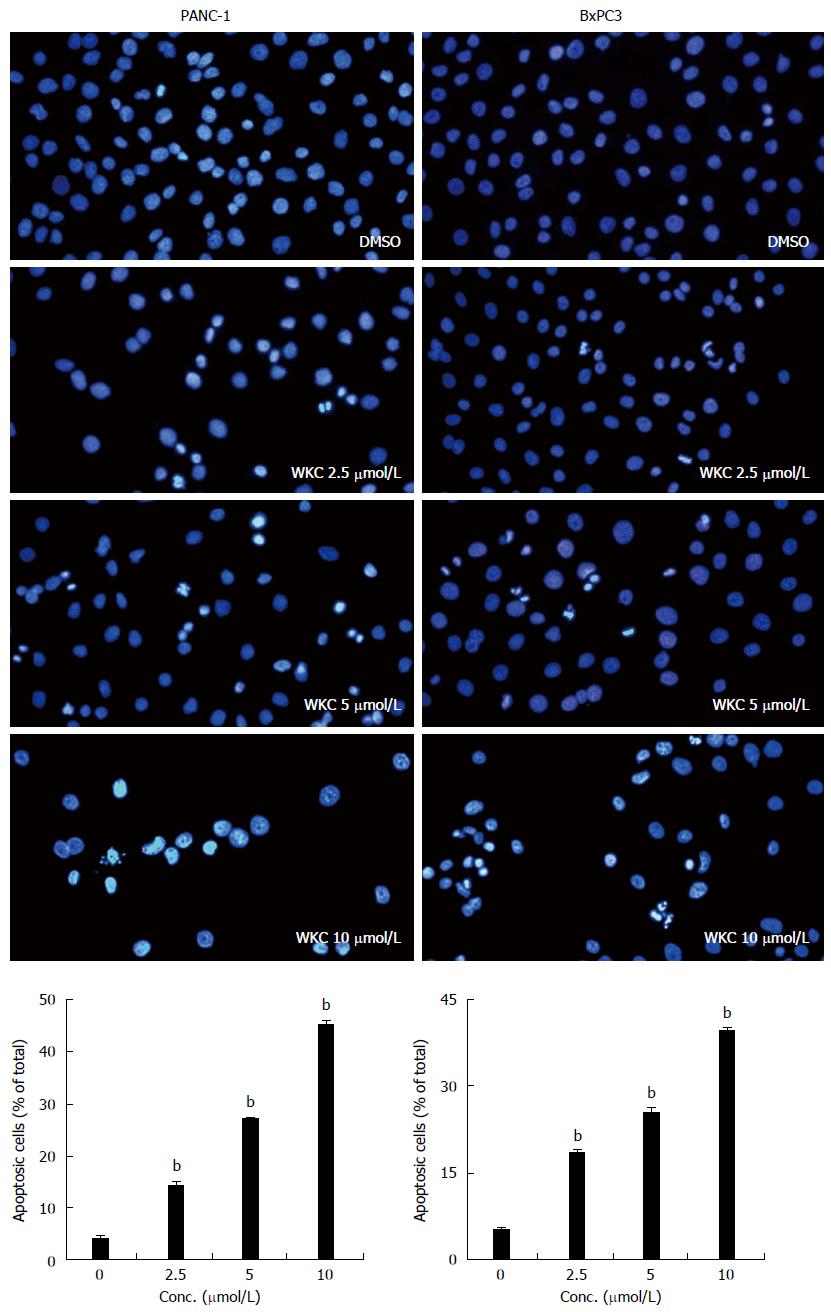
Figure 4 Apoptosis observed by Hoechst 33258 staining.
PANC-1 and BxPC3 cells were treated with 0, 2.5, 5 and 10 μmol/L of alternol for 24 h. The pictures are representative of three independent experiments. bP < 0.01 vs controls.
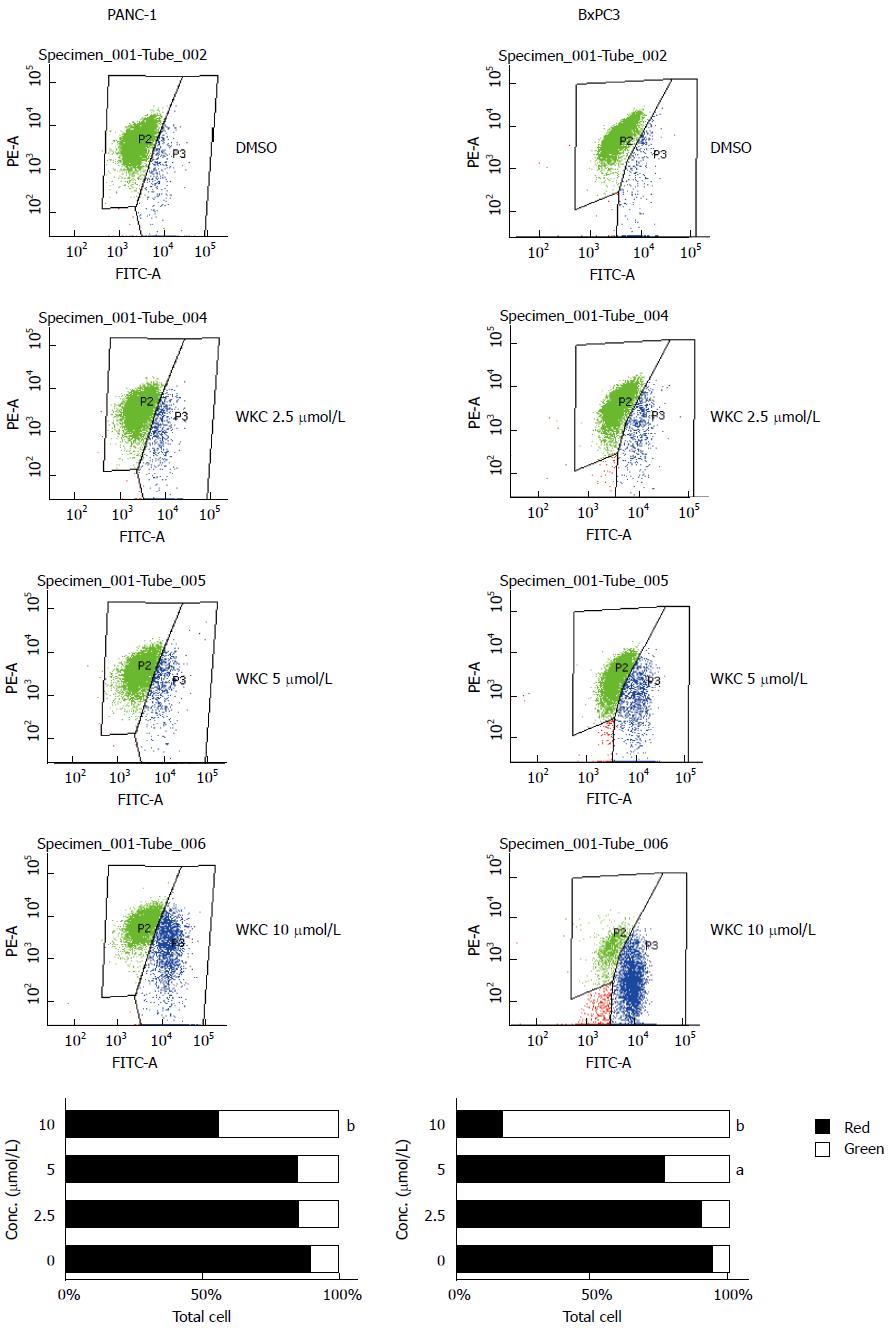
Figure 5 Decrease of mitochondrial membrane potential by alternol treatment in pancreatic cancer cells.
MMP was assessed by measuring fluorescence intensity of a membrane-potential-dependent dye JC-1 with flow cytometry. PANC-1 and BxPC3 cells were treated with 0, 2.5, 5 and 10 μmol/L alternol for 24 h. Data are means ± SE of three independent experiments. aP < 0.05, bP < 0.01 vs controls, significantly different by Student’s t-test.
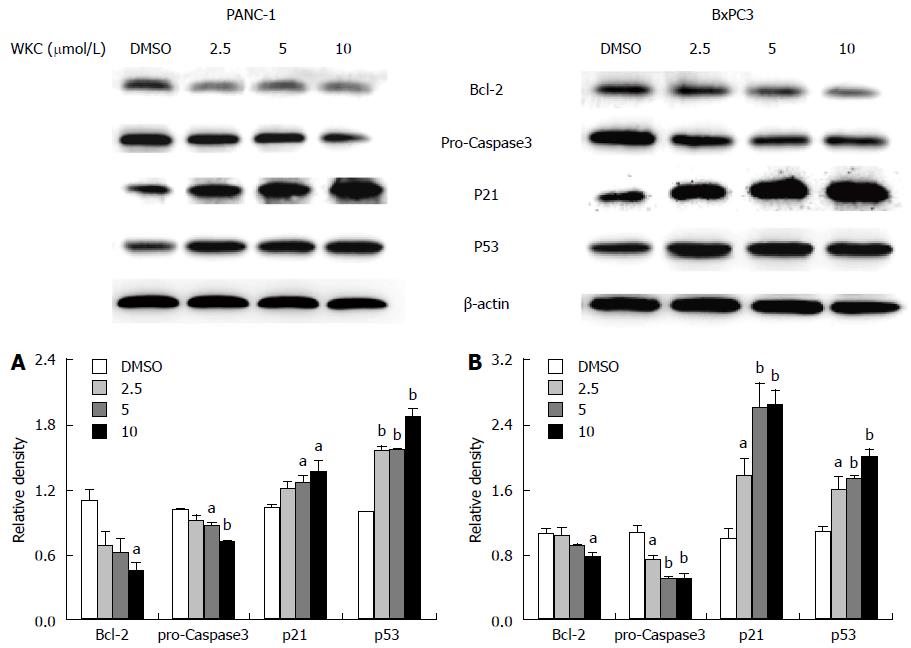
Figure 6 Western blot analysis of Bcl-2, p53, p21 and caspase 3 expression.
PANC-1 (A) and BxPC3 cells (B) were treated with 0, 2.5, 5 and 10 μmol/L of alternol for 24 h. The cells were harvested and processed for western blotting. β-Actin was used as the internal control. The pictures are representative of three independent experiments. aP < 0.05, bP < 0.01 vs controls.
- Citation: Cong PF, Qu YC, Chen JP, Duan LL, Lin CJ, Zhu XL, Li-Ling J, Zhang MX. Growth inhibition and apoptosis induction by alternol in pancreatic carcinoma cells. World J Gastroenterol 2015; 21(15): 4526-4535
- URL: https://www.wjgnet.com/1007-9327/full/v21/i15/4526.htm
- DOI: https://dx.doi.org/10.3748/wjg.v21.i15.4526


