Copyright
©The Author(s) 2015.
World J Gastroenterol. Apr 21, 2015; 21(15): 4517-4525
Published online Apr 21, 2015. doi: 10.3748/wjg.v21.i15.4517
Published online Apr 21, 2015. doi: 10.3748/wjg.v21.i15.4517
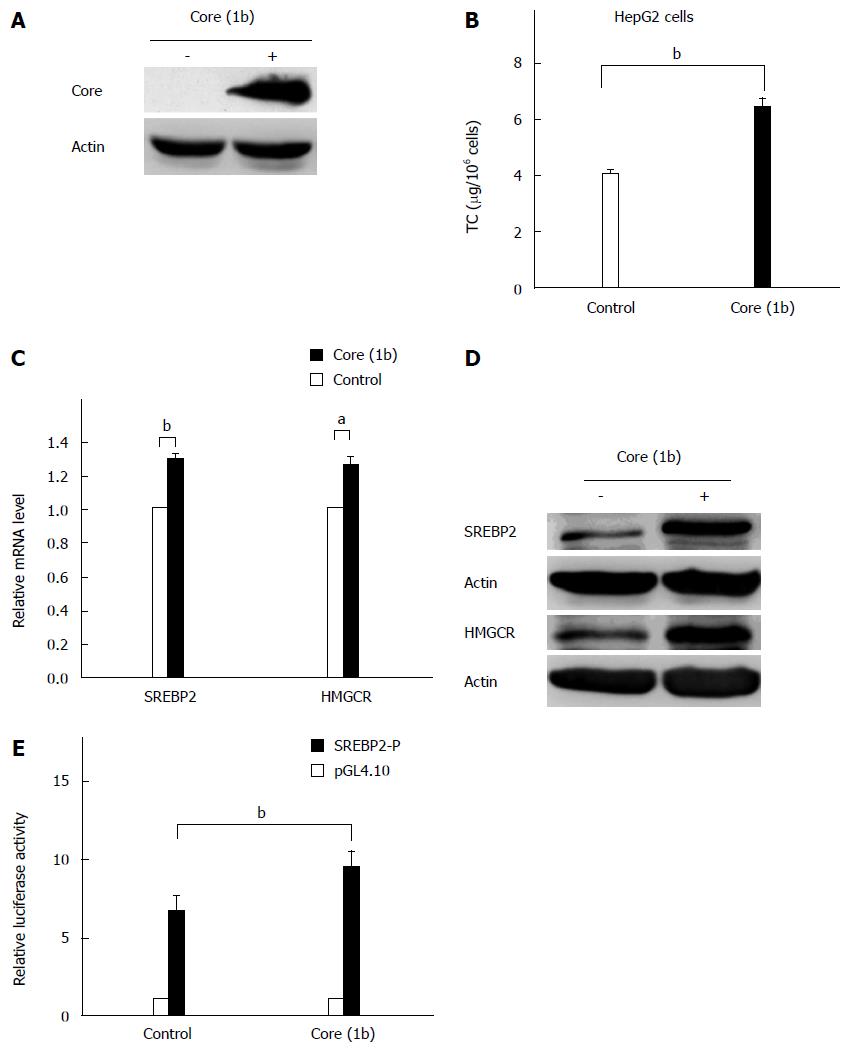
Figure 1 Hepatitis C virus core protein upregulates expression of sterol regulatory element binding protein 2 and intracellular total cholesterol levels in HepG2 cells.
A: HCV genotype 1b core protein was transfected into HepG2 cells and determined by Western blot 48 h after transfection; B: Intracellular TC levels were determined at 72 h after core protein transfection (n = 3, bP < 0.01); C: HCV core protein or a control vector was transfected into HepG2 cells. At 24 h after transfection, total RNA was isolated. Then quantitative PCR was performed to determine the relative mRNA levels of SREBP2 and HMGCR. β-actin was used as the internal control (n = 6, aP < 0.05, bP < 0.01 core vs control); D: HCV core protein or a control vector was transfected to HepG2 cells and SREBP2 and HMGCR expressions were analyzed by Western blot after 48 h; E: The -933 to +263 region of human SREBP2 promoter was amplified using genomic DNA isolated from HepG2 cells as template and cloned into pGL4.10 empty vector, named as SREBP2-P. The luciferase activity of SREBP2-P was determined 24 h after transfection with/without core protein expression (n = 3, bP < 0.01 core vs control). HCV: Hepatitis C virus; SREBP2: Sterol regulatory element binding protein 2; TC: Total cholesterol.
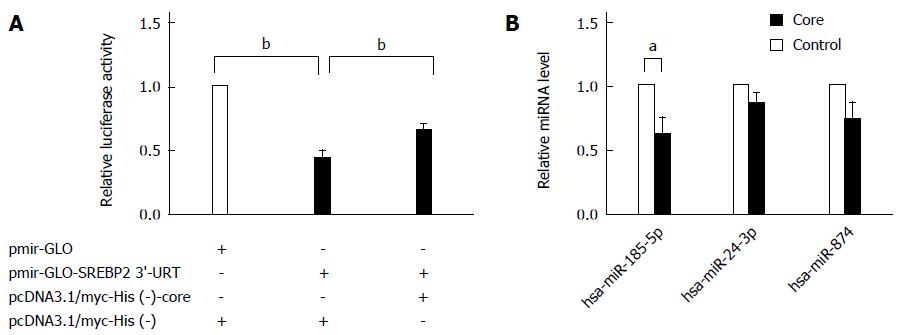
Figure 2 Hepatitis C virus core protein decreases the expression of miR-185-5p.
A: The 3’ untranslated region of sterol regulatory element binding protein 2 was co-transfected with control vector (middle) or core protein (right) into HepG2 cells, after 48 h, the relative luciferase activity was detected; Renilla luciferase activity acted as internal control for each transfected well (n = 3, bP < 0.01 core vs control); B: 48 h after transfection of a vector expressing the core protein, expression of selected miRNAs was analyzed by quantitative real-time PCR according to the prediction results. RNU6B was used to normalize the mature miRNAs expression levels (n = 3, aP < 0.05 core vs control).
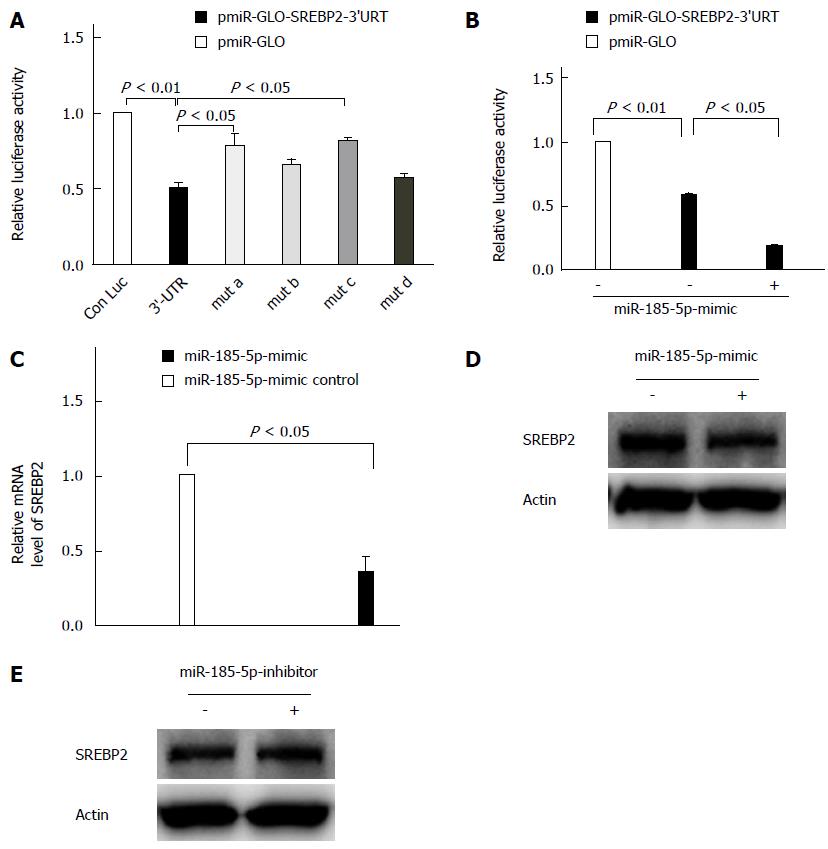
Figure 3 miR-185-5p targets the 3’-untranslated region of sterol regulatory element binding protein 2.
A: Luciferase activity was quantified in HepG2 cells transfected with a control luciferase reporter plasmid (Con Luc), SREBP2 3’ UTR-containing reporter plasmid (3’-UTR) and SREBP2 3’ UTR mutant (mut a, b, c, and d) 48 h after transfection (n = 3); B: For overexpression studies, 30 nmol/L miR-185-5p mimic or negative control miRNA was co-transfected with pmirGLO-SREBP2 3’-UTR luciferase constructs. At 48 h after transfection, the relative luciferase activity was detected (n = 3); C: HepG2 cells were transfected with miR-185-5p mimic or negative control miRNA (30 nmol/L) for 48 h, and then the mRNA level of SREBP2 was detected (n = 3); D: HepG2 cells were transfected with miR-185-5p mimic or negative control miRNA (30 nmol/L), and the protein expression of SREBP2 was determined 72 h after transfection; E: HepG2 cells were transfected with miR-185-5p inhibitor or negative control miRNA (30 nmol/L), and the protein expression level of SREBP2 was determined 72 h after transfection. SREBP2: Sterol regulatory element binding protein 2; UTR: Untranslated region.
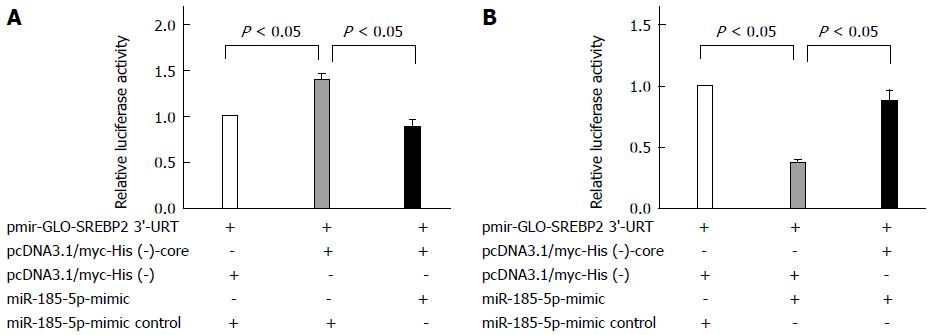
Figure 4 Upregulation of sterol regulatory element binding protein 2 by Hepatitis C virus core protein involves miR-185-5p.
A: 30 nmol/L miR-185-5p mimic or negative control miRNA was co-transfected with pmirGLO-SREBP2 3’-UTR luciferase constructs into HepG2 cells overexpressing core protein for 48 h, and the relative luciferase activity was detected (n = 3); B: In the presence of pmirGLO-SREBP2 3’-UTR, 30 nmol/L of miR-185-5p mimic was co-transfected with either HCV core protein or the indicated null vector into HepG2 cells for 48 h, and the relative luciferase activity was then detected (n = 3). SREBP2: Sterol regulatory element binding protein 2; UTR: Untranslated region.
- Citation: Li M, Wang Q, Liu SA, Zhang JQ, Ju W, Quan M, Feng SH, Dong JL, Gao P, Cheng J. MicroRNA-185-5p mediates regulation of SREBP2 expression by hepatitis C virus core protein. World J Gastroenterol 2015; 21(15): 4517-4525
- URL: https://www.wjgnet.com/1007-9327/full/v21/i15/4517.htm
- DOI: https://dx.doi.org/10.3748/wjg.v21.i15.4517


