Copyright
©The Author(s) 2015.
World J Gastroenterol. Mar 14, 2015; 21(10): 3072-3084
Published online Mar 14, 2015. doi: 10.3748/wjg.v21.i10.3072
Published online Mar 14, 2015. doi: 10.3748/wjg.v21.i10.3072
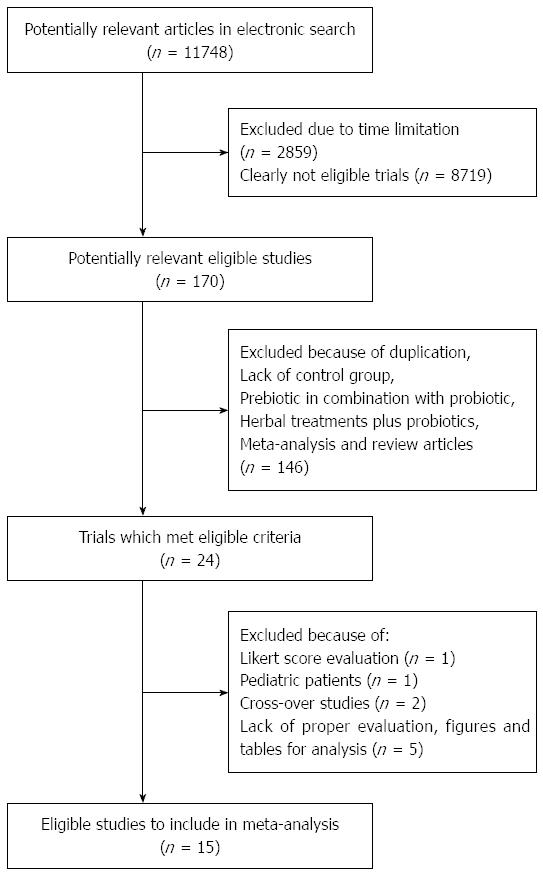
Figure 1 Flow diagram for study selection.
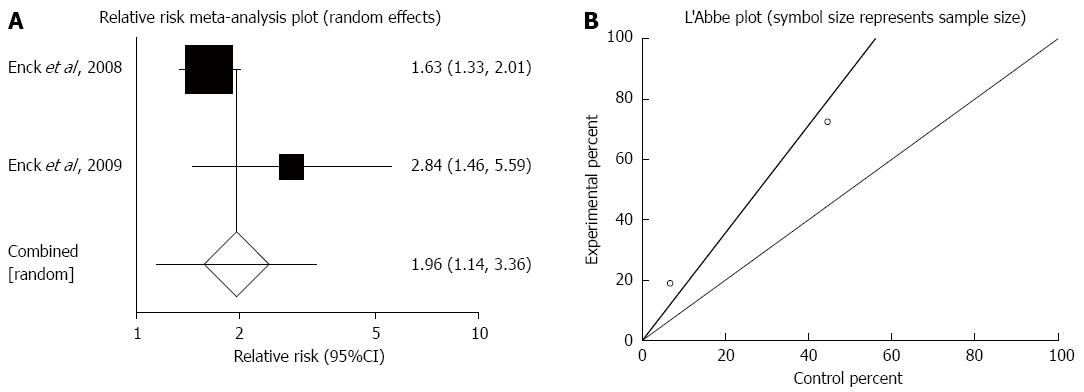
Figure 2 Responders to therapies based on abdominal pain score.
A: Individual and pooled relative risk in studies comparing probiotics and placebo in irritable bowel syndrome patients; B: Heterogeneity indicators for the studies.
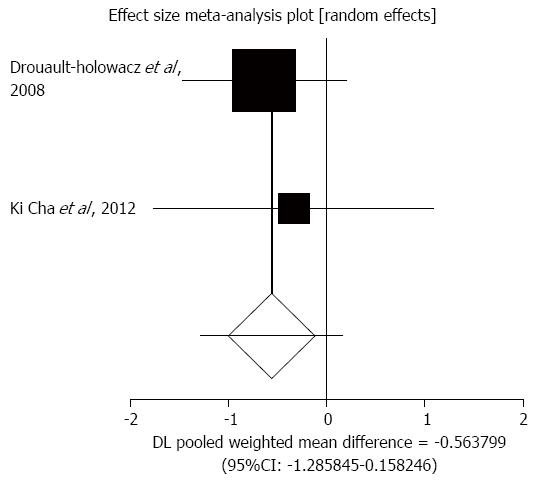
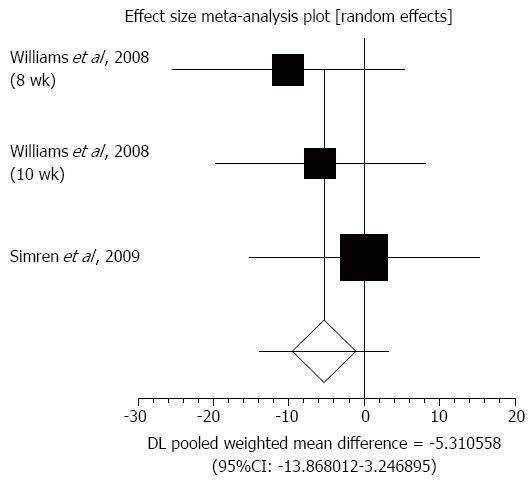
Figure 3 Individual and pooled effect size for standardized mean for abdominal pain in studies comparing probiotics and placebo in irritable bowel syndrome patients.
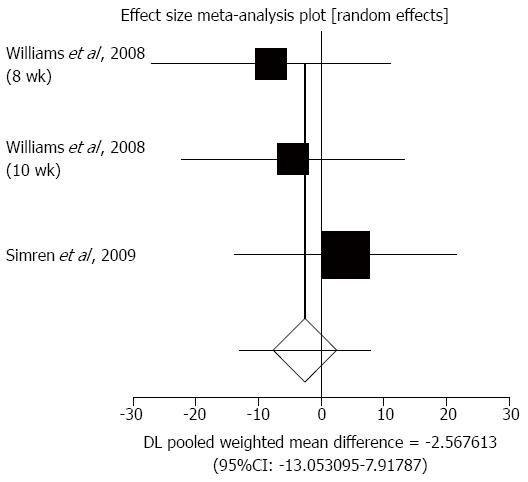
Figure 4 Individual and pooled effect size for standardized mean for distension, bloating, and flatulence in studies comparing probiotics and placebo in irritable bowel syndrome patients.
Figure 5 Individual and pooled effect size for standardized mean for bowel habit dissatisfaction in studies comparing probiotics and placebo in irritable bowel syndrome patients.
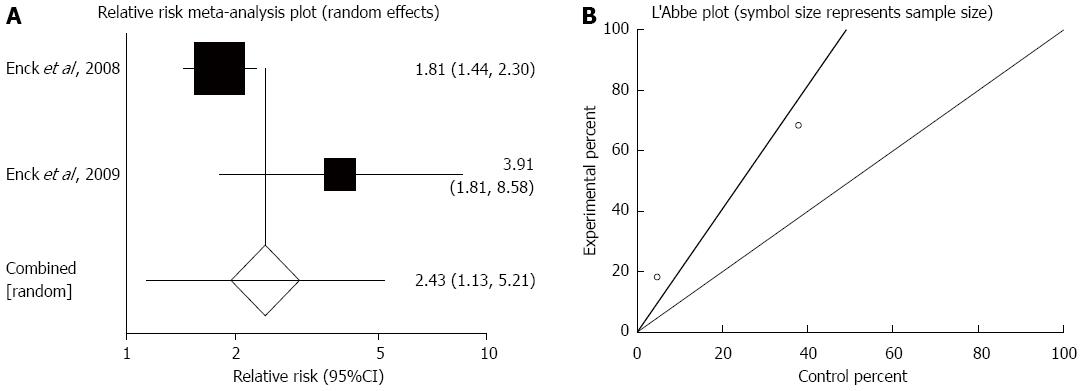
Figure 6 Responders to therapies based on global symptom score.
A: Individual and pooled relative risk in studies comparing probiotics and placebo in irritable bowel syndrome patients; B: Heterogeneity indicators for the studies.
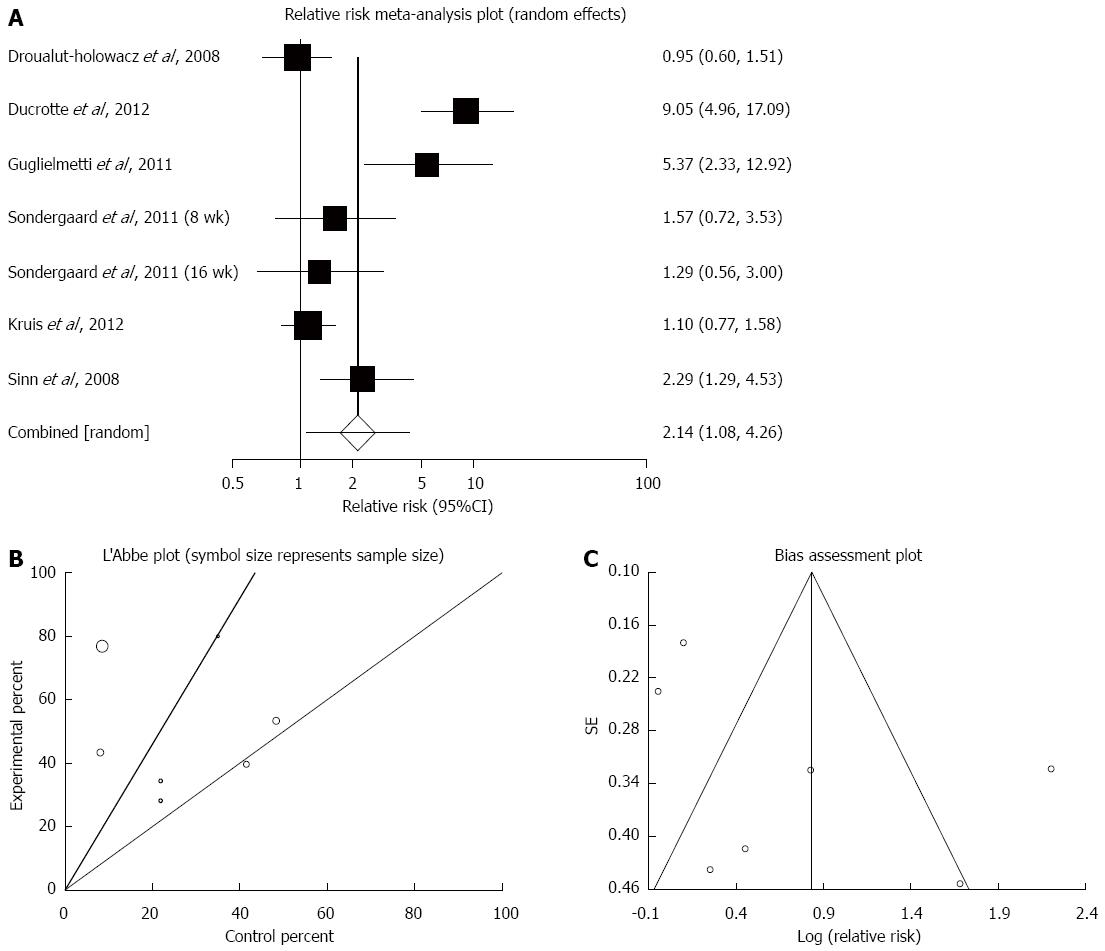
Figure 7 Adequate general symptoms improvement.
A: Individual and pooled relative risk in studies comparing probiotics and placebo irritable bowel syndrome patients; B: Heterogeneity indicators for the studies; C: Publication bias indicators.
- Citation: Didari T, Mozaffari S, Nikfar S, Abdollahi M. Effectiveness of probiotics in irritable bowel syndrome: Updated systematic review with meta-analysis. World J Gastroenterol 2015; 21(10): 3072-3084
- URL: https://www.wjgnet.com/1007-9327/full/v21/i10/3072.htm
- DOI: https://dx.doi.org/10.3748/wjg.v21.i10.3072


