Copyright
©2014 Baishideng Publishing Group Co.
World J Gastroenterol. Feb 28, 2014; 20(8): 2062-2070
Published online Feb 28, 2014. doi: 10.3748/wjg.v20.i8.2062
Published online Feb 28, 2014. doi: 10.3748/wjg.v20.i8.2062
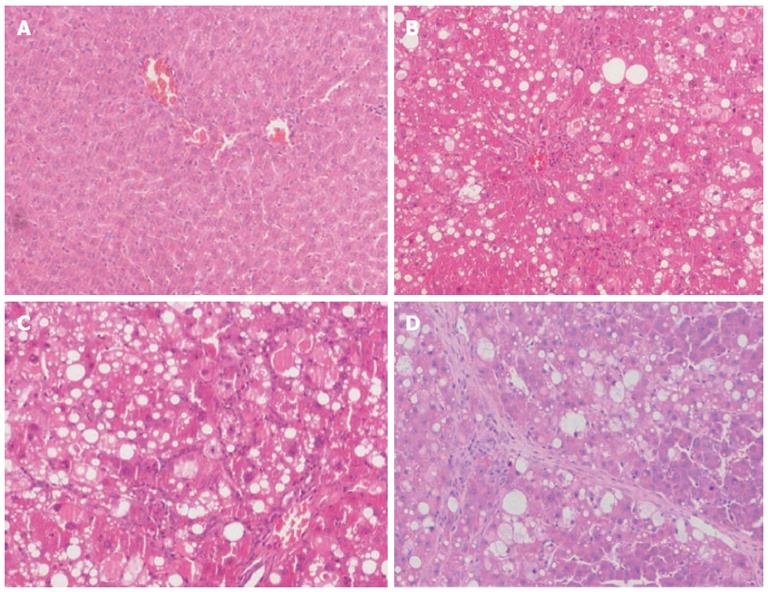
Figure 1 Pathological changes in the liver after carbon tetrachloride administration (hematoxylin and eosin, original magnification, × 100).
A: Control group; B: 4-wk group; C: 8-wk group; D: 12-wk group.
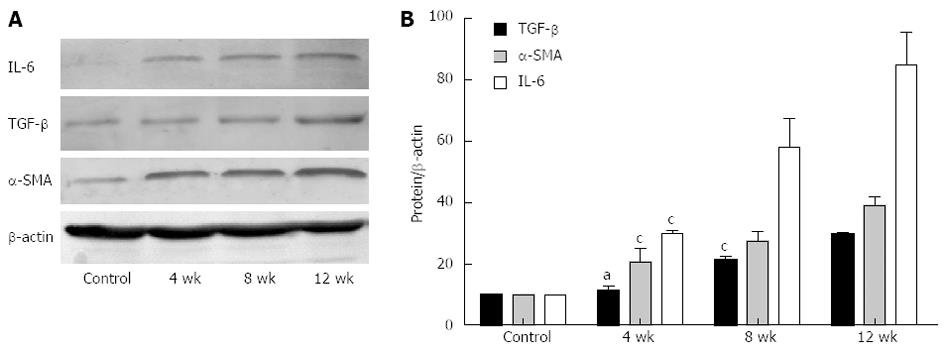
Figure 2 Expression of proteins in the liver at different times.
A: Western blotting; B: Quantitive analysis, aP > 0.05 vs control, cP < 0.05 vs control. α-SMA: α-Smooth muscle actin; IL: Interleukin; TGF: Transforming growth factor.
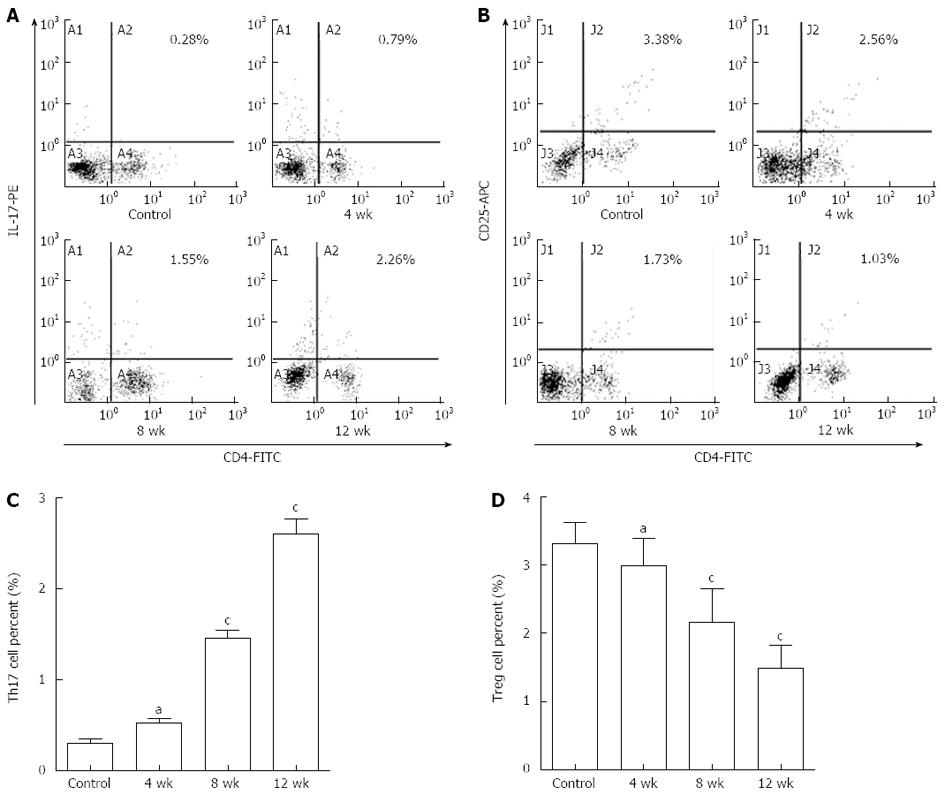
Figure 3 Changes in T helper 17 and T regulatory cells in the liver after carbon tetrachloride administration.
A and B: Representative images of Th17 (A) and Treg (B) cells at different times after CCl4 administration; C and D: Proportions of Th17 (C) and Treg (D) cells. aP > 0.05 vs control, cP < 0.05 vs control. CCl4: Carbon tetrachloride; Th17: T helper 17; Treg: T regulatory; IL: Interleukin; FITC: Fluorescein isothiocyanate.
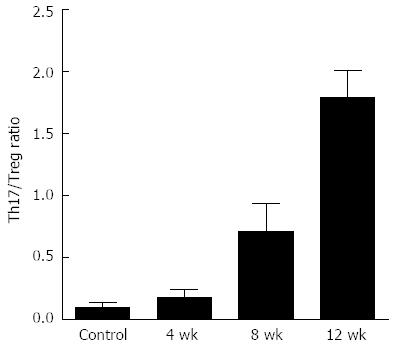
Figure 4 T helper 17/T regulatory ratio in the control and 4-, 8- and 12-wk groups.
Th17: T helper 17; Treg: T regulatory.
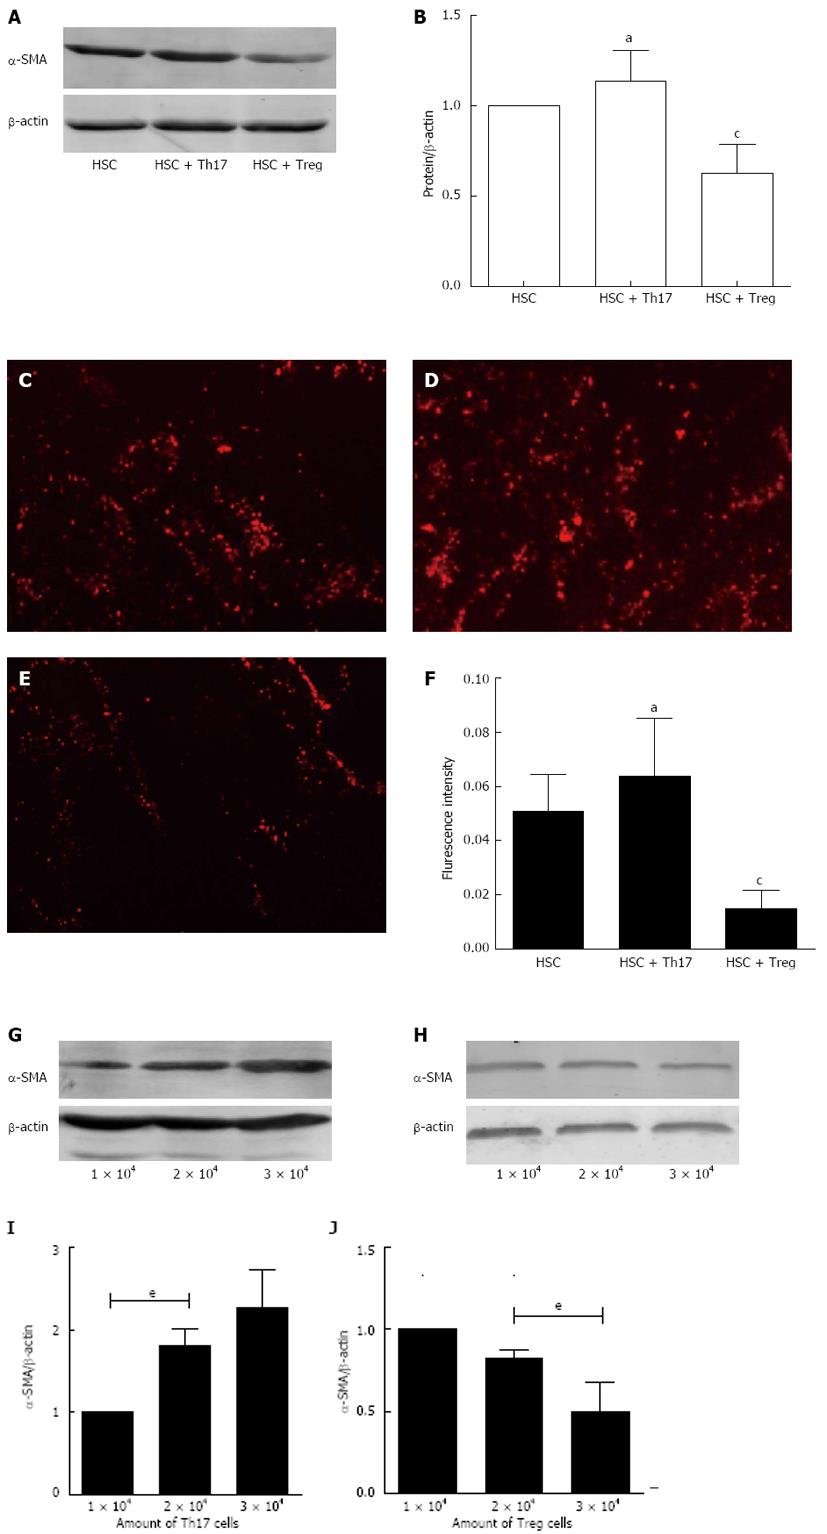
Figure 5 α-Smooth muscle actin expression after different treatment.
A and B: Western blotting and quantitative analysis of α-SMA; C-E: Immunofluorescence staining (C: HSCs; D: HSCs + Th17 cells; E: HSCs + Treg cells. Original magnification, × 200); F: Fluorescence intensity of α-SMA; G and I: Western blotting and quantitative analysis after HSCs treated with different numbers of Th17 cells; H and J: Western blotting and quantitative analysis after HSCs treated with different numbers of Treg cells. aP > 0.05 vs control, cP < 0.05 vs control; eP < 0.05 vs 1 × 10⁴ cells, P > 0.05 vs 2 × 10⁴ cells. α-SMA: α-Smooth muscle actin; HSCs: Hepatic stellate cells; Th17: T helper 17; Treg: Th17/T regulatory.
- Citation: Sun XF, Gu L, Deng WS, Xu Q. Impaired balance of T helper 17/T regulatory cells in carbon tetrachloride-induced liver fibrosis in mice. World J Gastroenterol 2014; 20(8): 2062-2070
- URL: https://www.wjgnet.com/1007-9327/full/v20/i8/2062.htm
- DOI: https://dx.doi.org/10.3748/wjg.v20.i8.2062


