Copyright
©2014 Baishideng Publishing Group Co.
World J Gastroenterol. Feb 21, 2014; 20(7): 1852-1857
Published online Feb 21, 2014. doi: 10.3748/wjg.v20.i7.1852
Published online Feb 21, 2014. doi: 10.3748/wjg.v20.i7.1852
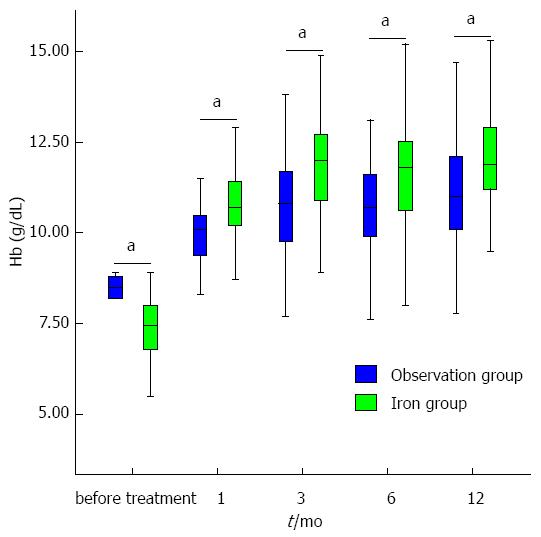
Figure 1 Changes in hemoglobin levels 1, 3, and 6 mo after treatment in the iron and observation groups.
aP < 0.05 between iron and observation groups.
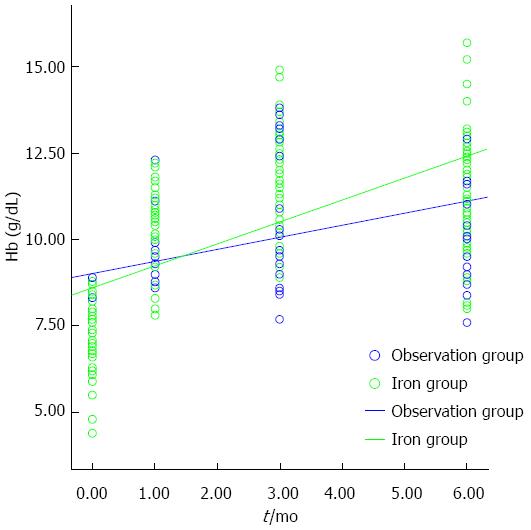
Figure 2 Estimation of slopes for changes in hemoglobin levels in the iron and observation groups by univariate linear regression test.
- Citation: Yoon HM, Kim YW, Nam BH, Reim D, Eom BW, Park JY, Ryu KW. Intravenous iron supplementation may be superior to observation in acute isovolemic anemia after gastrectomy for cancer. World J Gastroenterol 2014; 20(7): 1852-1857
- URL: https://www.wjgnet.com/1007-9327/full/v20/i7/1852.htm
- DOI: https://dx.doi.org/10.3748/wjg.v20.i7.1852


