Copyright
©2014 Baishideng Publishing Group Co.
World J Gastroenterol. Feb 14, 2014; 20(6): 1554-1564
Published online Feb 14, 2014. doi: 10.3748/wjg.v20.i6.1554
Published online Feb 14, 2014. doi: 10.3748/wjg.v20.i6.1554
Figure 1 Characterization of Na+-dependent D-[3H]-aspartate uptake in HepG2 hepatoblastoma cells.
A: D-[3H]-aspartate (30 nmol/L) uptake was measured after 6 min incubation with intact HepG2 cells treated with vehicle (controls), t-PDC (1 mmol/L), TBOA (1 mmol/L) or DHK (100 μmol/L) for 15 min. Data shown are mean ± SE of at least three independent experiments performed in quadruplicate. bP < 0.001 as compared to control (paired student t-test); B: Saturation isotherms for D-[3H]-aspartate (1-100 μmol/L) uptake measured in HepG2 cells. Data shown correspond to mean values with SE from quadruplicate measures on four independent series; C: Immunofluorescence detection of EAAT2 transporter on HepG2 cells using specific polyclonal antibody. Immunoreactivity was visualized using a FITC-conjugated rabbit anti-goat antibody, and cell nuclei appear in blue (DNA staining with DAPI) (original magnification × 200). t-PDC: L-trans-pyrrolidine-2,4-dicarboxylic acid; TBOA: Threo-beta-benzyloxyaspartate; DHK: Dihydrokainic acid; DAPI: 4’,6-diamidino-2-phenylindole.
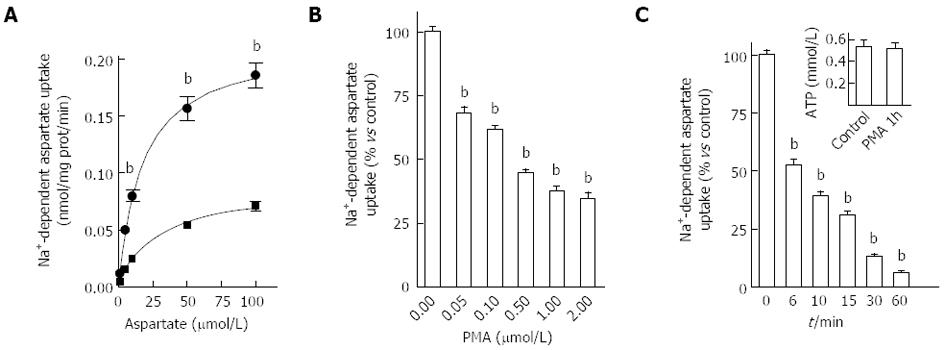
Figure 2 Modulation of aspartate uptake capacity by phorbol 12-myristate 13-acetate in HepG2 cells.
A: Saturation curve for D-[3H]-aspartate uptake measured in HepG2 cells treated for 15 min with 500 nmol/L phorbol 12-myristate 13-acetate (PMA) (squares) or vehicle (circles). Data shown correspond to mean values ± SE of typical experiments performed four times in quadruplicate; B: Effect of pre-treating HepG2 cells with increasing concentrations of PMA for 15 min on D-[3H]-aspartate uptake. Data are expressed as percent of control and correspond to mean ± SE of three independent experiments performed in quadruplicate; C: modulation of D-[3H]-aspartate uptake on HepG2 cells after incubation with 500 nmol/L PMA for different periods of time. Results are expressed as percent of control (non treated cells) and correspond to means ± SE of three independent experiments performed in quadruplicate. Inset shows the data obtained after the analysis of intracellular ATP levels in HepG2 cells after treatment with 500 nmol/L PMA for 1 h. Data shown correspond to mean values ± SE of typical experiments performed four times in quadruplicate.
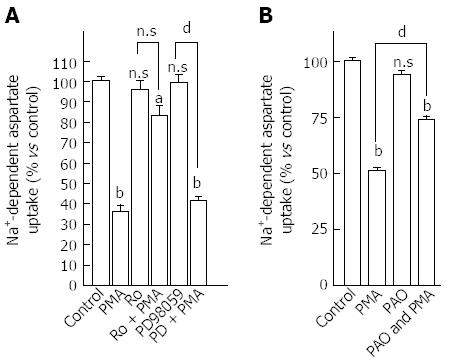
Figure 3 Mechanism pathways modulated by protein kinase C to regulate aspartate uptake capacity in HepG2 cells.
A: Involvement of protein kinase C (PKC) pathway in the modulation of EAAT2 activity in HepG2 cells; Cells were pretreated with 1 μmol/L Ro-31-8220 or vehicle for 15 min. Thereafter, phorbol 12-myristate 13-acetate (PMA) (500 nmol/L) was added and the uptake assay was performed after 15 min. Data shown are means ± SE of three independent experiments performed in triplicate. PMA significantly inhibited D-[3H]-aspartate uptake, Ro-31-8220 had a non-intrinsic effect on aspartate uptake, and completely blocked the effect of PMA on aspartate uptake (Ro-31-8220 vs PMA plus Ro-31-8220 not significantly different). PD09859, a selective inhibitor of the MAPK pathway, failed to prevent the PMA-decrease in aspartate uptake; B: Effect of L-aspartate and phenylarsine oxide (PAO) on basal and PMA-decreased aspartate uptake in HepG2 cells. Cells were pretreated with PAO (10 μmol/L) or vehicle for 15 min. Thereafter, PMA (500 nmol/L) was added and the uptake assay was performed after 15 min. Results are expressed as percent of untreated cells and correspond to means ± SE of at least three independent experiments performed in triplicate. Statistical analysis was performed by One-way ANOVA followed by the Tukey’s test for multiple comparisons. aP < 0.05; bP < 0.001 vs the corresponding untreated control cells; and dP < 0.001 denotes a difference between PMA-treated cells with or without the pharmacological agent.
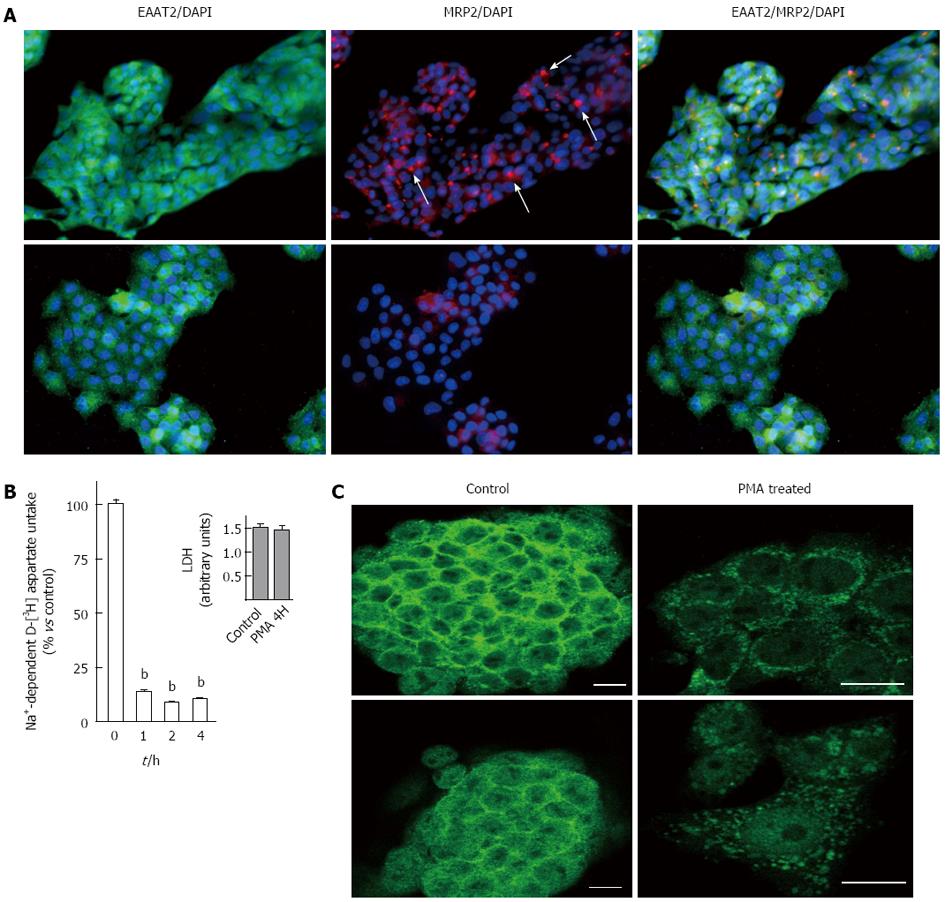
Figure 4 Effect of long-term treatment with phorbol 12-myristate 13-acetate on EAAT2 expression in HepG2 cells.
A: Effect of phorbol 12-myristate 13-acetate (PMA) on multidrug resistance protein 2 (MRP2) cell surface distribution. Cells were treated with 500 nmol/L PMA (lower panels) or vehicle (upper panels) for 4 h, fixed and incubated with anti-EAAT2 and anti-MRP2 primary antibody. Immunoreactivity was visualized using FITC-conjugated rabbit anti-goat and cyanine-3-conjugated goat anti-mouse antibodies respectively. Cell nuclei appear in blue (DNA staining with DAPI). In control HepG2 cells, the MRP2 transporter is mainly localized at the canalicular side. Such organization is absent in PMA-treated cells. Images were representative of several fields examined from 3 independent experiments (original magnification × 200); B: Effect of pre-treating HepG2 cells with PMA for 1, 2 and 4 h on D-[3H]-aspartate uptake. Data are expressed as percent of control and correspond to mean ± SE of three independent experiments performed in sextuplicate. Inset shows the data obtained after the analysis of extracellular LDH levels in HepG2 cell cultures treated with 500 nmol/L PMA or vehicle for 4 h. Data shown correspond to mean values ± SE of typical experiments performed four times; C: Effect of PMA treatment on EAAT2 immunostaining distribution in HepG2 cells was analyzed by confocal microscopy. Cells were treated with 500 nmol/L PMA or vehicle for 4 h, fixed and incubated with anti-EAAT2 primary antibody. Immunoreactivity was visualized using a fluorescein isothiocyanate-conjugated goat anti-rabbit antibody. Images (single optical slides through the cells) were representative of several fields examined from 3 independent experiments. Original magnification is × 200 for controls and × 400 for PMA treated groups. Scale bar, 20 μm. DAPI: 4’,6-diamidino-2-phenylindole; LDH: Lactate dehydrogenase.
Figure 5 Effect of phorbol 12-myristate 13-acetate treatment on EAAT2 mRNA expression in HepG2 cells.
Reverse transcription polymerase chain reaction (PCR) analysis of phorbol 12-myristate 13-acetate (PMA)-treated HepG2 cells for EAAT2 (A) and GAPDH (B) mRNA levels. Total mRNA was isolated from HepG2 cells treated with vehicle (C) or 500 nmol/L PMA for 4 h (P) as described in Methods. EAAT2 (341 base pairs) and GAPDH (302 base pairs) mRNAs were amplified by 26, 28 and 30 PCR cycles in the presence of specific primers and separated on a 1.5% agarose gel stained with ethidium bromide. M: Molecular marker.
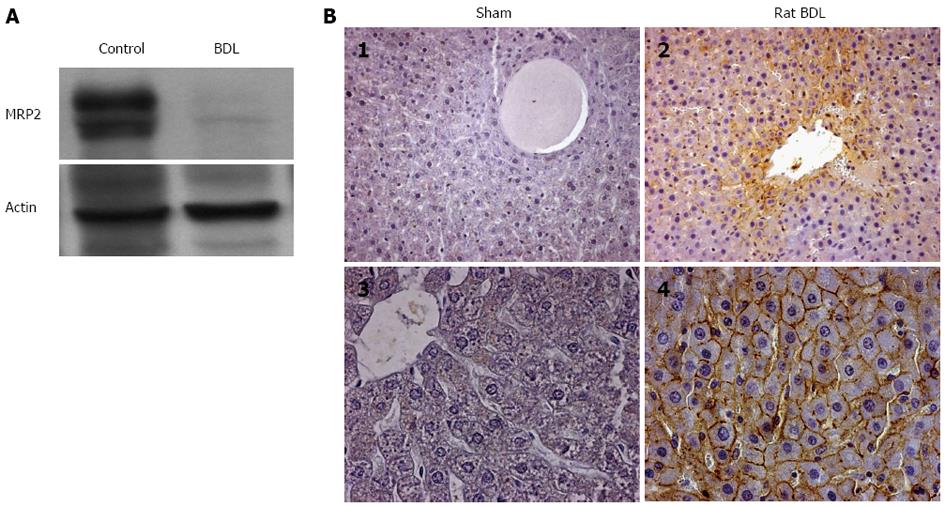
Figure 6 GLT-1/EAAT2 transporter expression in rat liver after bile duct ligation.
A: Immunoblot analysis of multidrug resistance protein 2 transporter and actin protein expression in the liver of sham-operated (control, n = 4) and bile duct ligated (BDL, n = 4) rats. Fifty µg of total protein extract were loaded and subjected to sodium dodecyl sulfate-polyacrylamide gel electrophoresis. Immunoblots are representative of at least three independent experiments; B: Immunohistochemical localization of the GLT-1/EAAT2 transporter in liver sections of sham operated (B1, B3) and bile duct ligated (B2, B4) rats. Immunohistochemistry was performed on paraffin-embedded liver sections using specific antibody for GLT-1 as described in Methods. (B1 and B3) in sham-operated liver rats, no GLT-1 immunoreactivity is observed in hepatocytes. After BDL, (B2 and B4) GLT-1 immunoreactivity is detected as a specific cell surface staining in hepatocytes [original magnification × 200 (B1, B2) and × 400 (B3, B4) respectively].
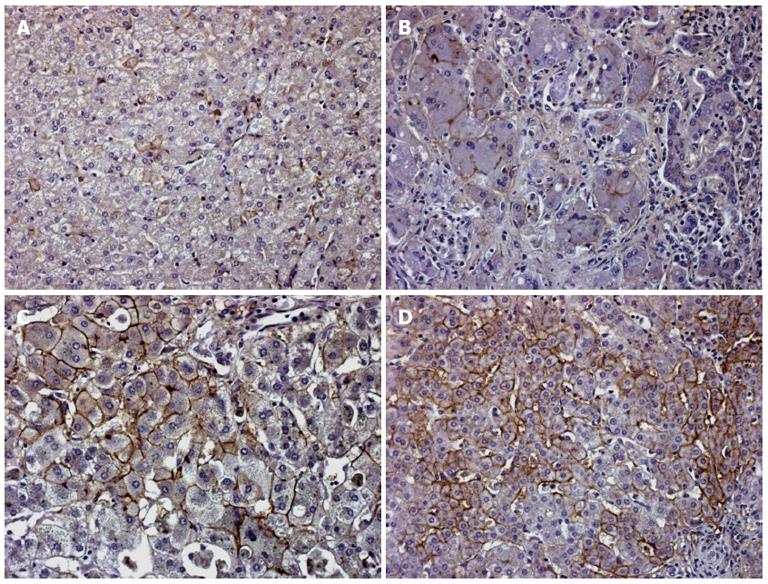
Figure 7 EAAT2 transporter expression in human cholestatic liver tissue.
A: In non cholestatic liver disease, some rare hepatocytes show membranous staining; B: In PFIC type 2, this expression increased, but was still limited to some hepatocytes. In the case of biliary atresia (C) and progressive familial intrahepatic cholestasis (PFIC) type 3 (D), the membrane expression is strong and observed in numerous hepatocytes (original magnification × 200).
- Citation: Najimi M, Stéphenne X, Sempoux C, Sokal E. Regulation of hepatic EAAT-2 glutamate transporter expression in human liver cholestasis. World J Gastroenterol 2014; 20(6): 1554-1564
- URL: https://www.wjgnet.com/1007-9327/full/v20/i6/1554.htm
- DOI: https://dx.doi.org/10.3748/wjg.v20.i6.1554


